Dive deep into company financials
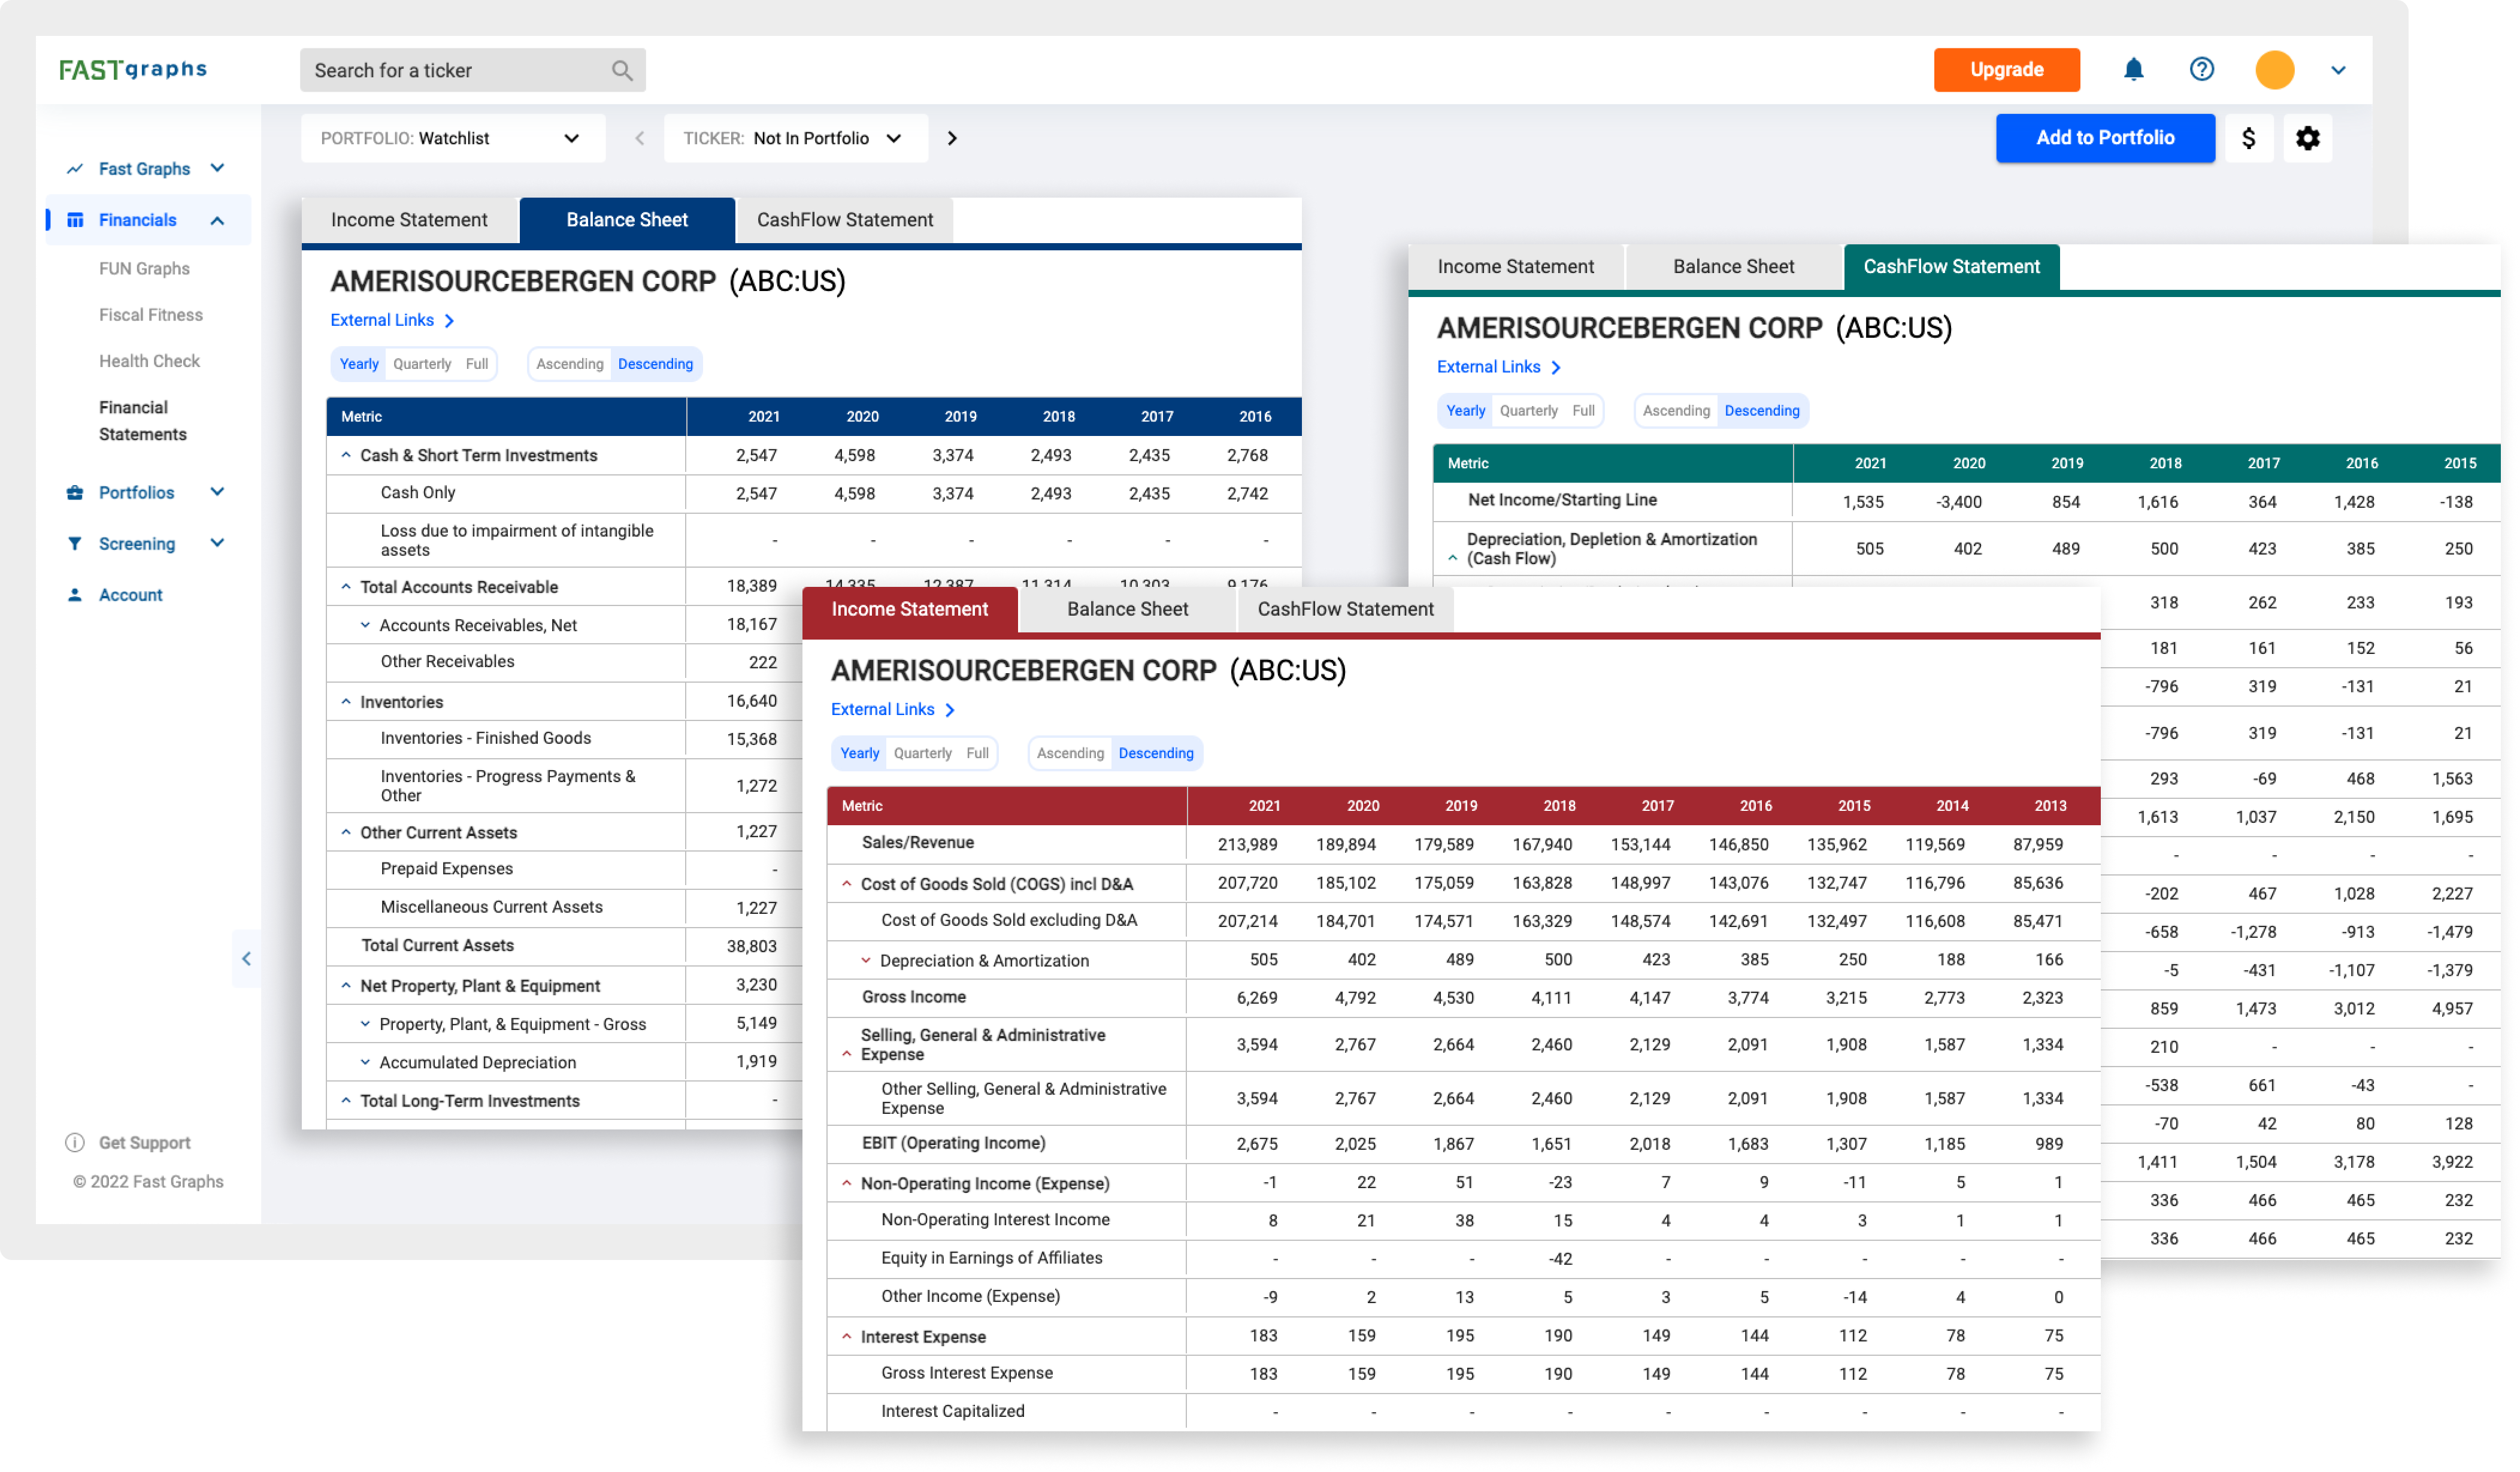
Financials allow you to dive into the numbers behind the company. You can look at full financial statements and even graph important metrics to find important correlations and relationships.
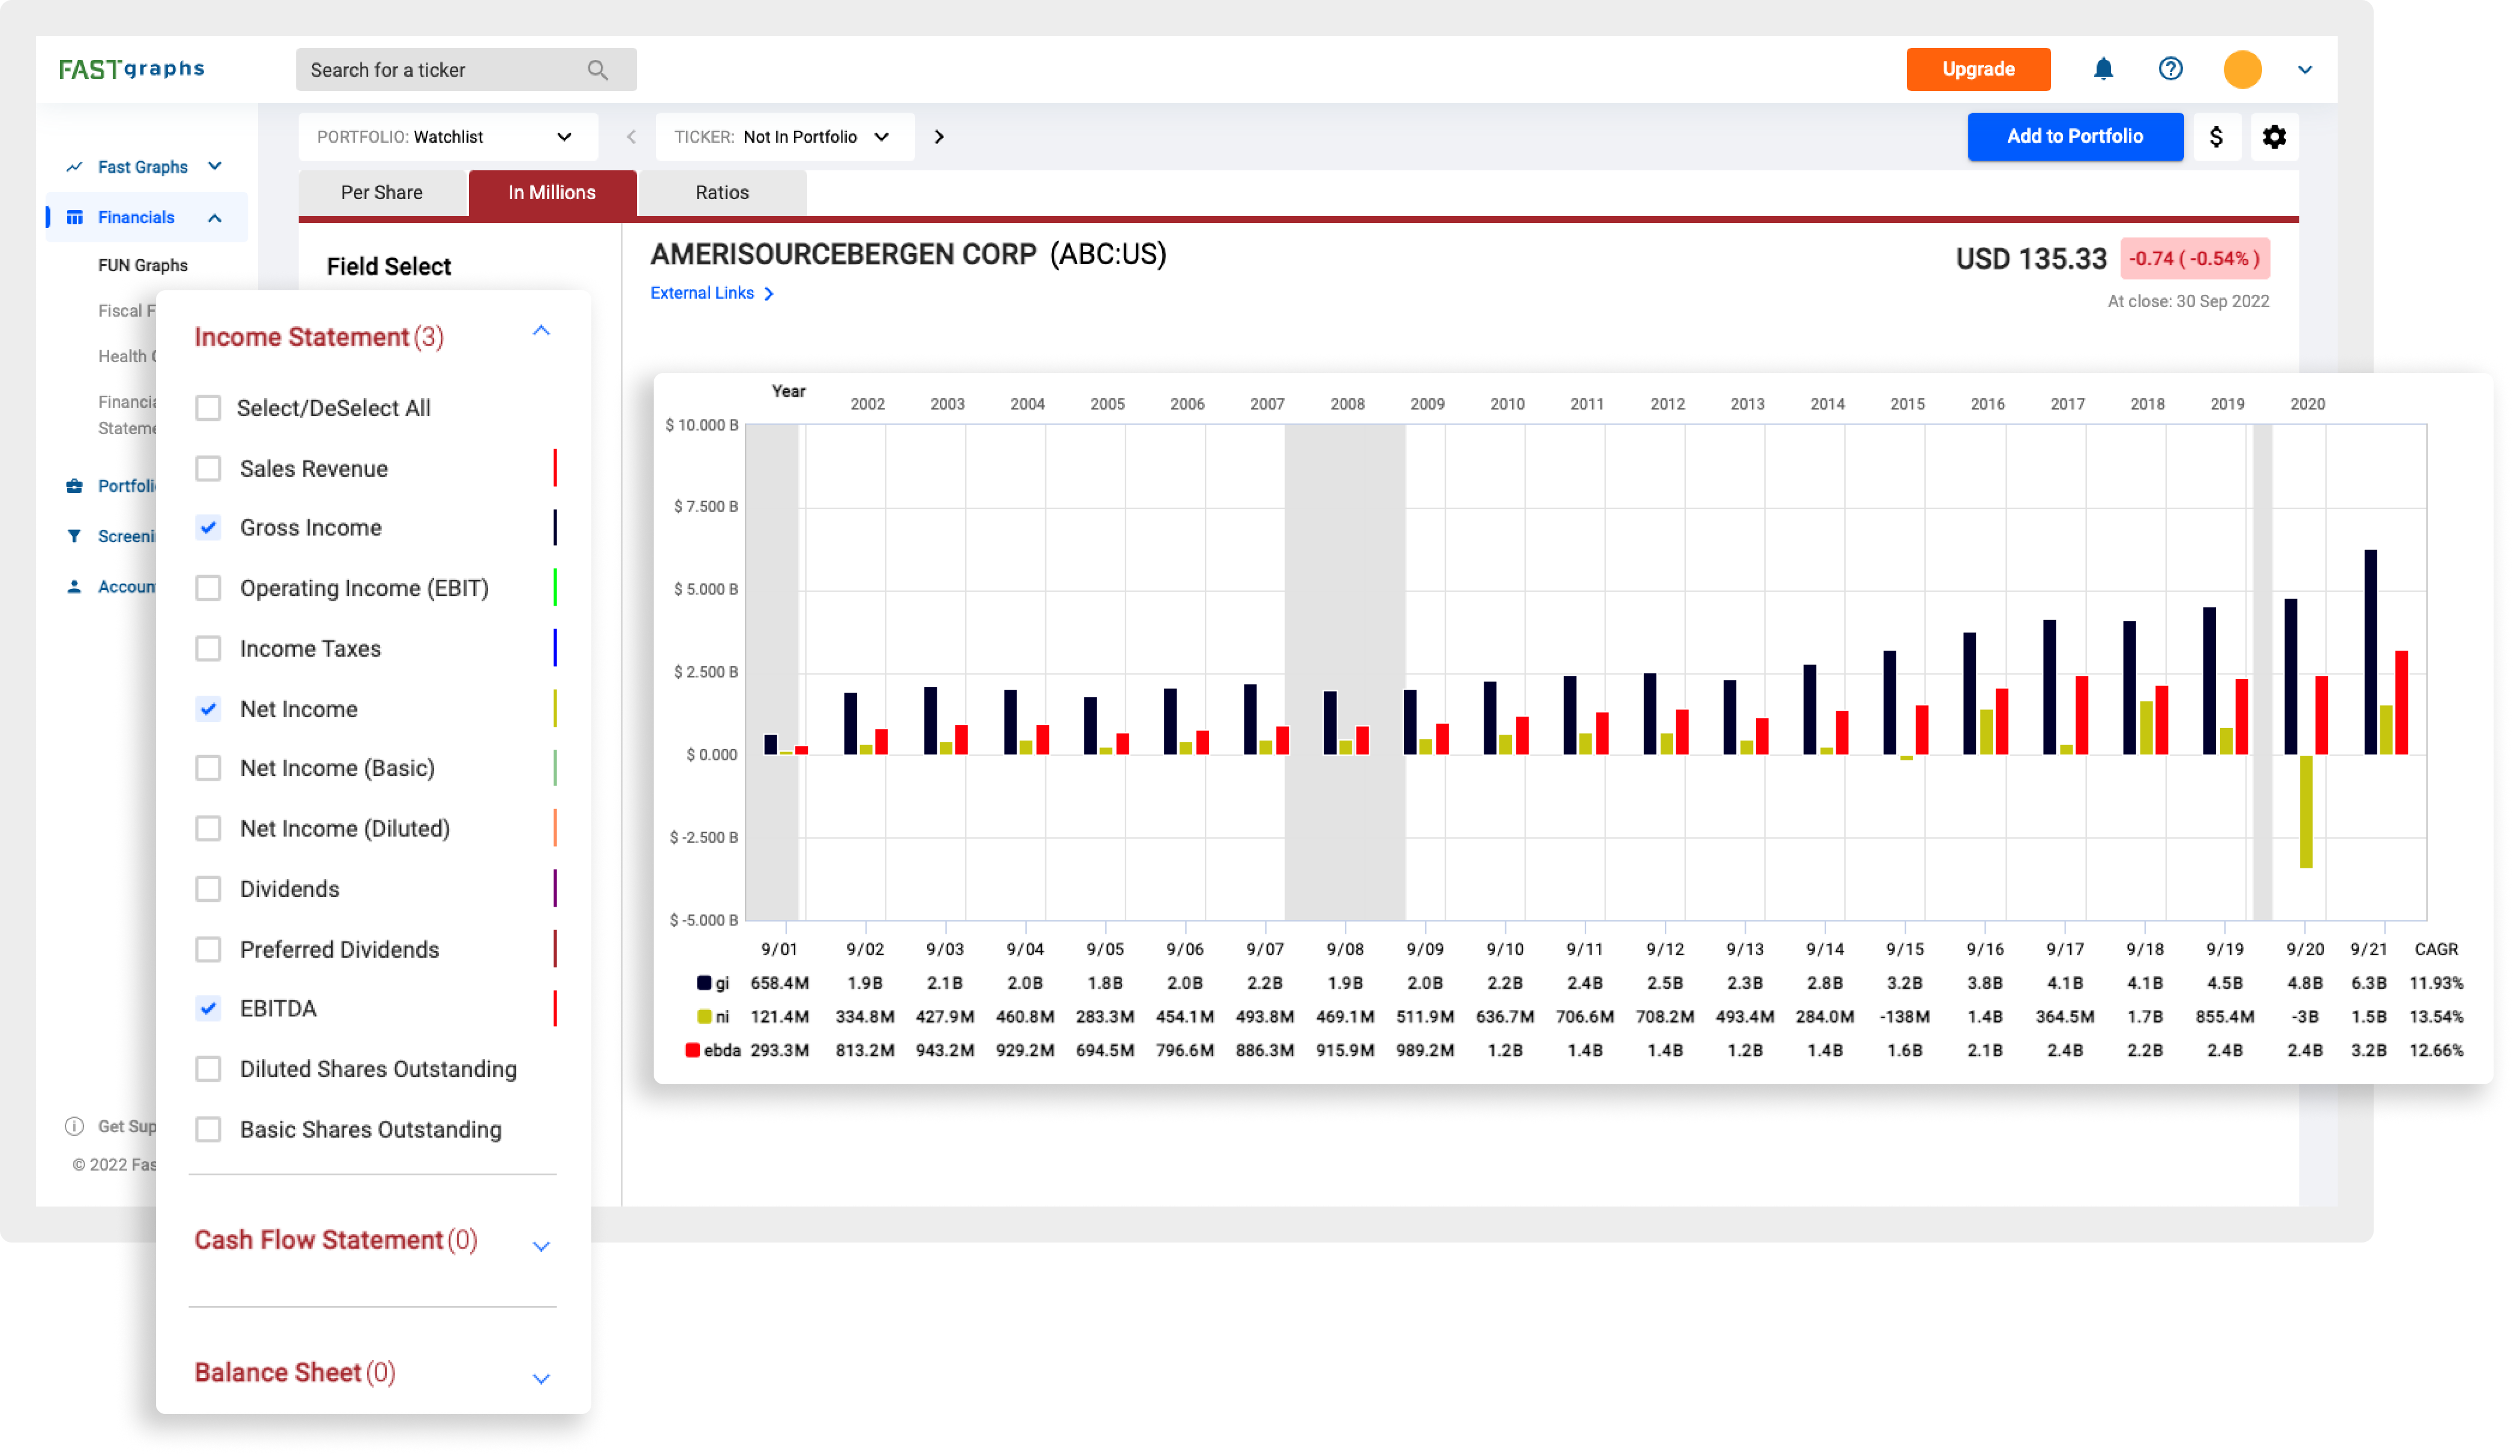
FUN Graphs provide you with the key metrics from each financial statement to help dissect and discover trends and correlations.
By looking at company financials in either per share or per millions views, you can easily identify past and present trends. Analysis of these two different data sets can even help discover when manipulation has occurred.
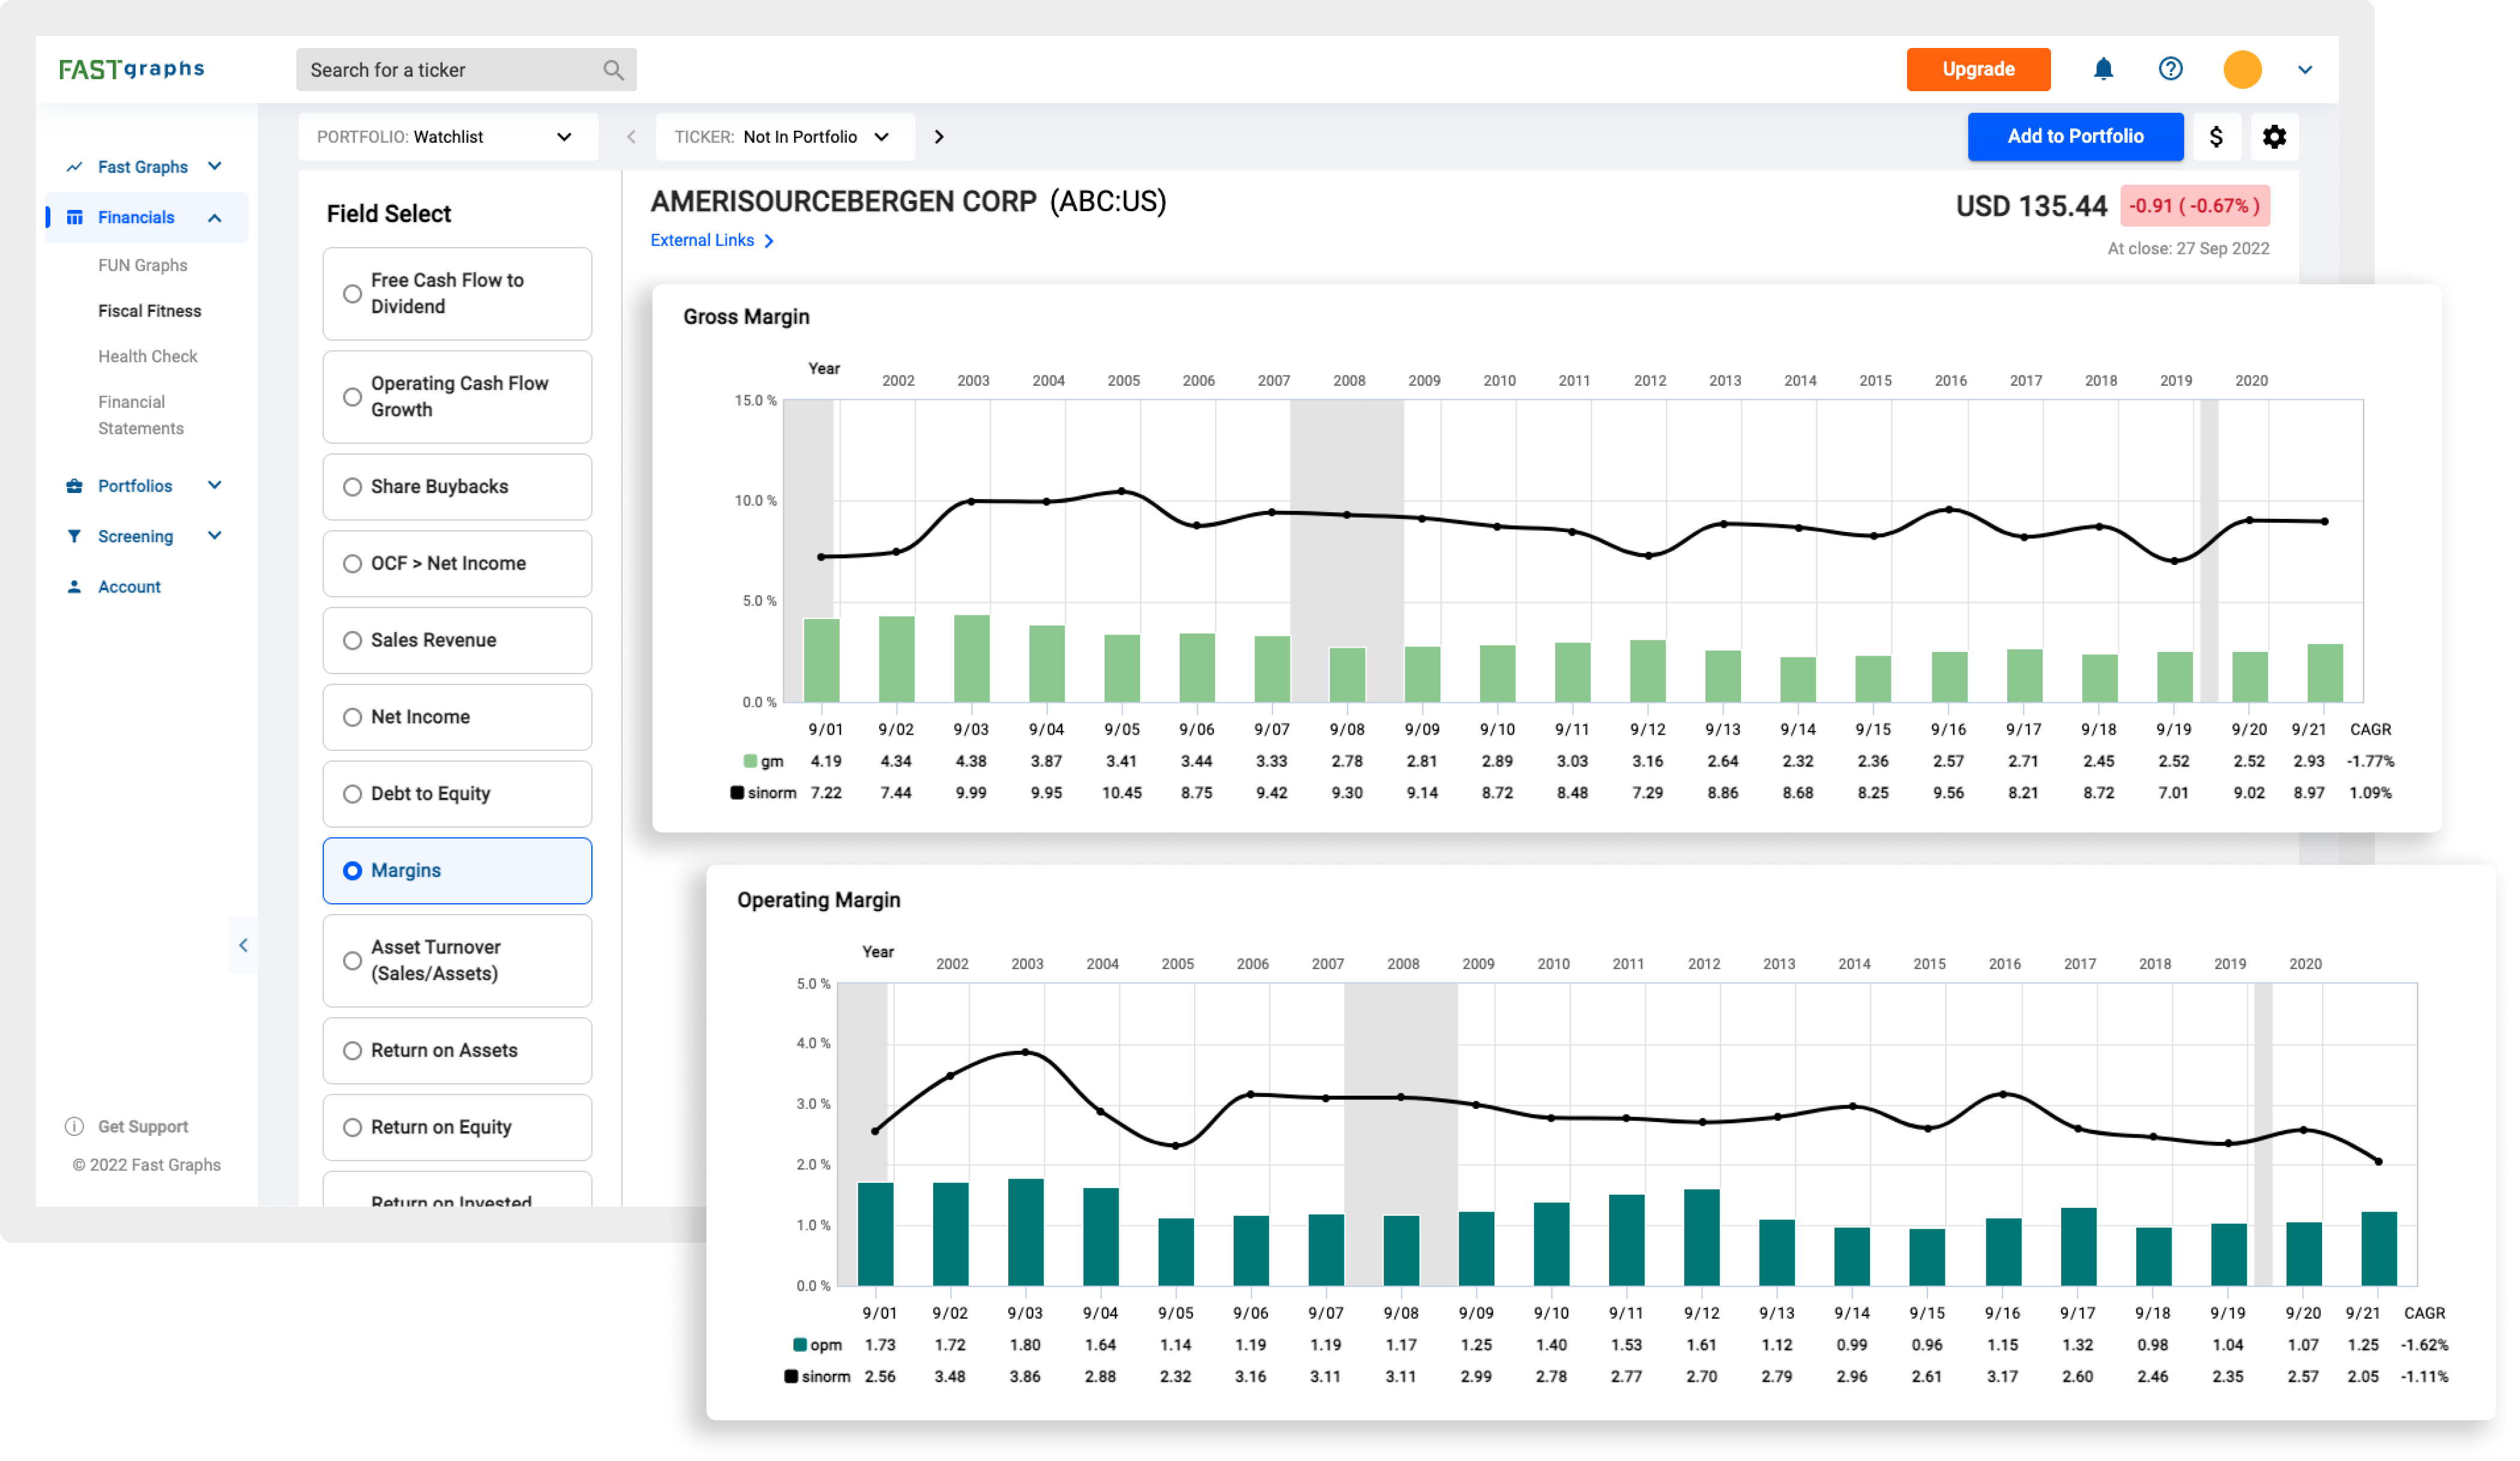
Under the Fiscal Fitness section, you are provided with 12 important metrics to analyze. These 12 metrics have been pre identified as certain ratios and relationships that are key to identifying healthy companies.
Fiscal Fitness analyzes data from across all 3 of the Financial Statements to help give you better and more informed knowledge about the numbers behind a company.
Access up to 20 years of historical financial statement data all in one place. Jump into the details and find out how a company operates, and uncover any anomalies in data you may see.