FAST Graphs is a stock analysis software built for rational, long-term investors. It transforms financial data into visual insights so you can see what a company is truly worth.
Get Started
Analyze, compare, and understand any company with precision. Combine powerful visualization with deep financial data to help you uncover the real value of every stock you study.
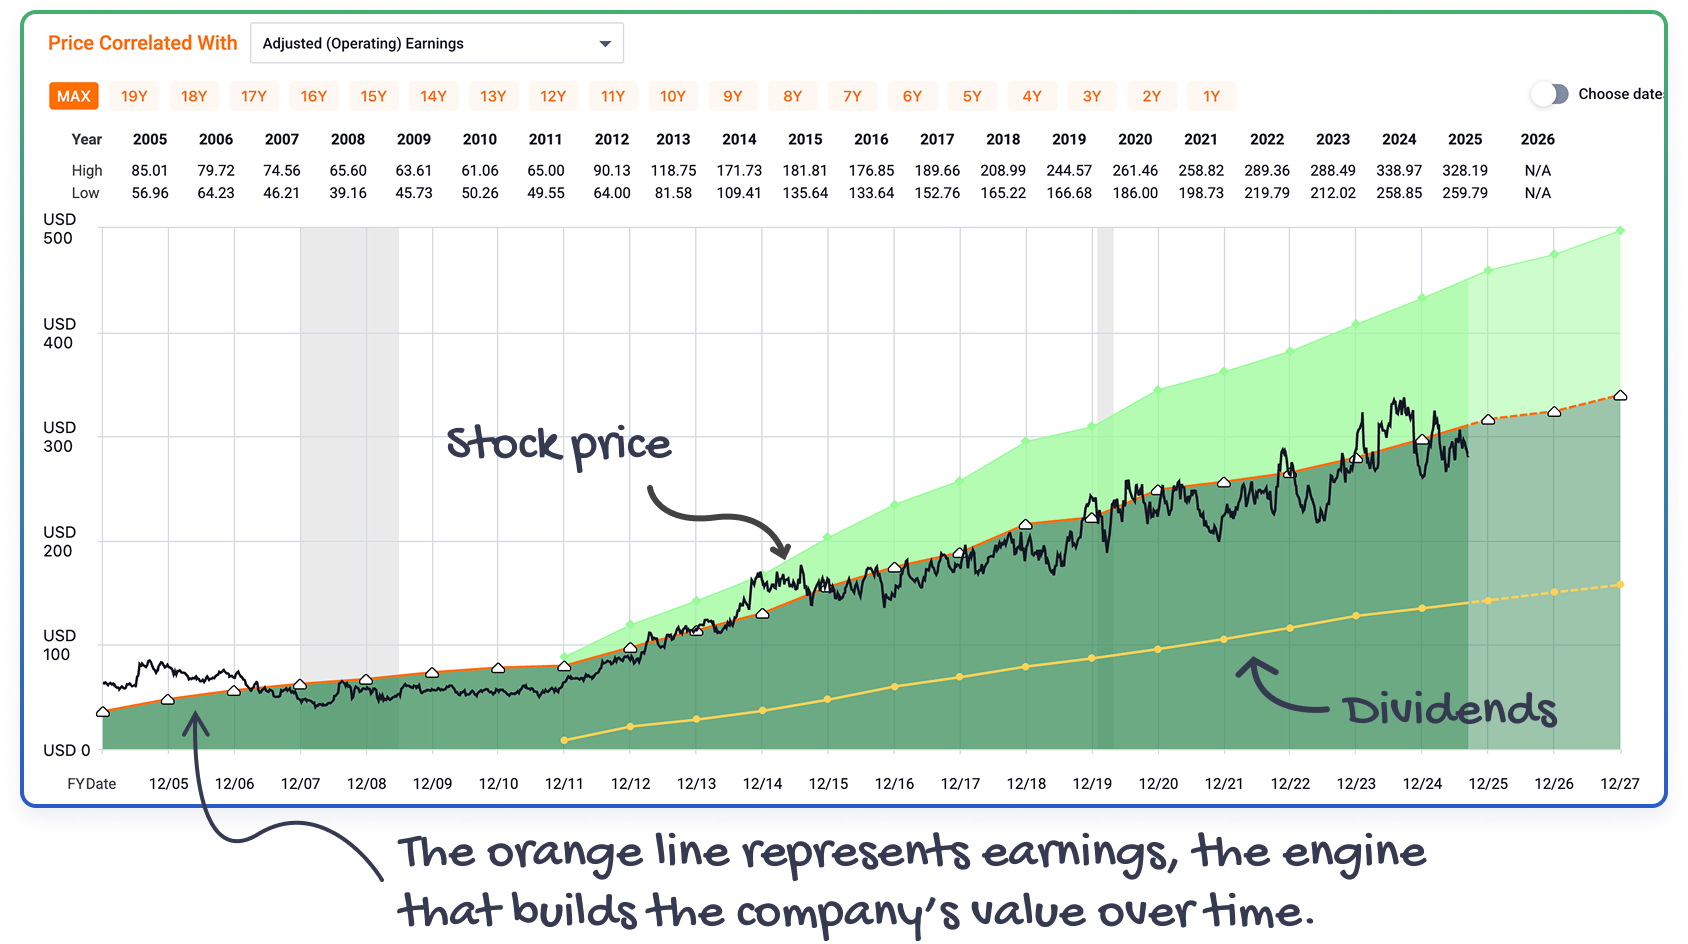
FAST Graphs brings investing back to its foundation: owning a business, not a stock. Each chart begins with the company’s fundamental strength and growth, then adds price so you can see whether the market is being sensible or speculative.
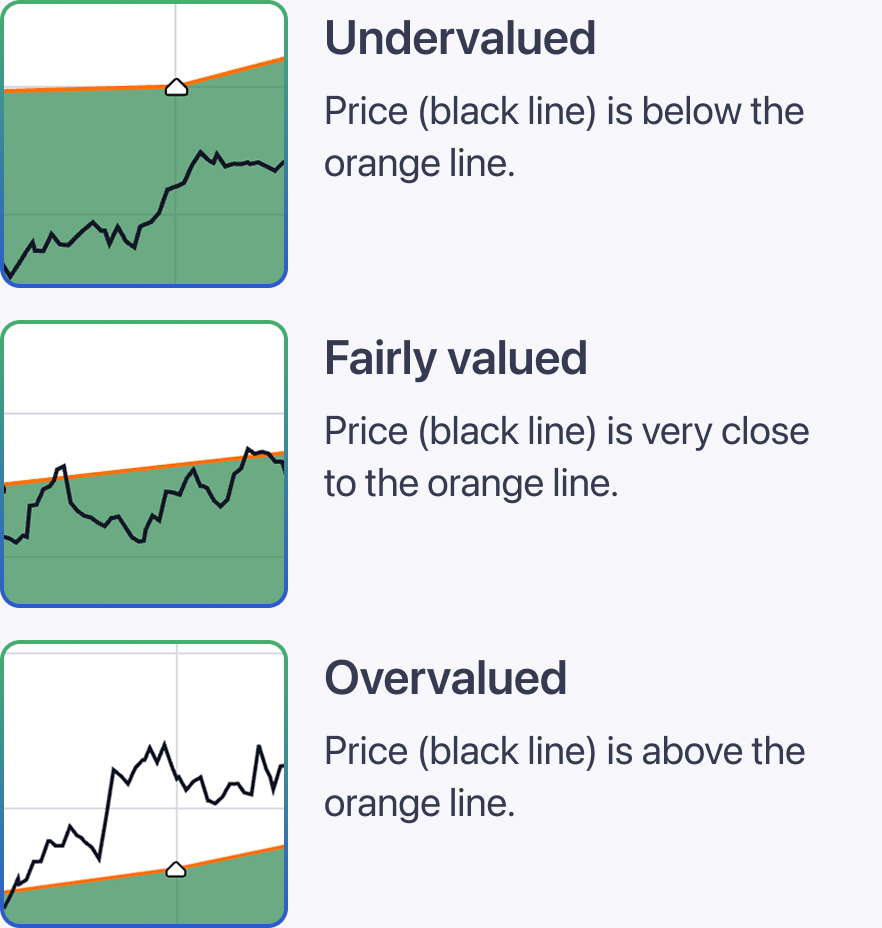
All of these questions can be answered quickly just by looking at FAST Graphs. Figure out if you are overpaying for a stock, or investing in a company that isn’t growing fast enough to meet your goals and needs.
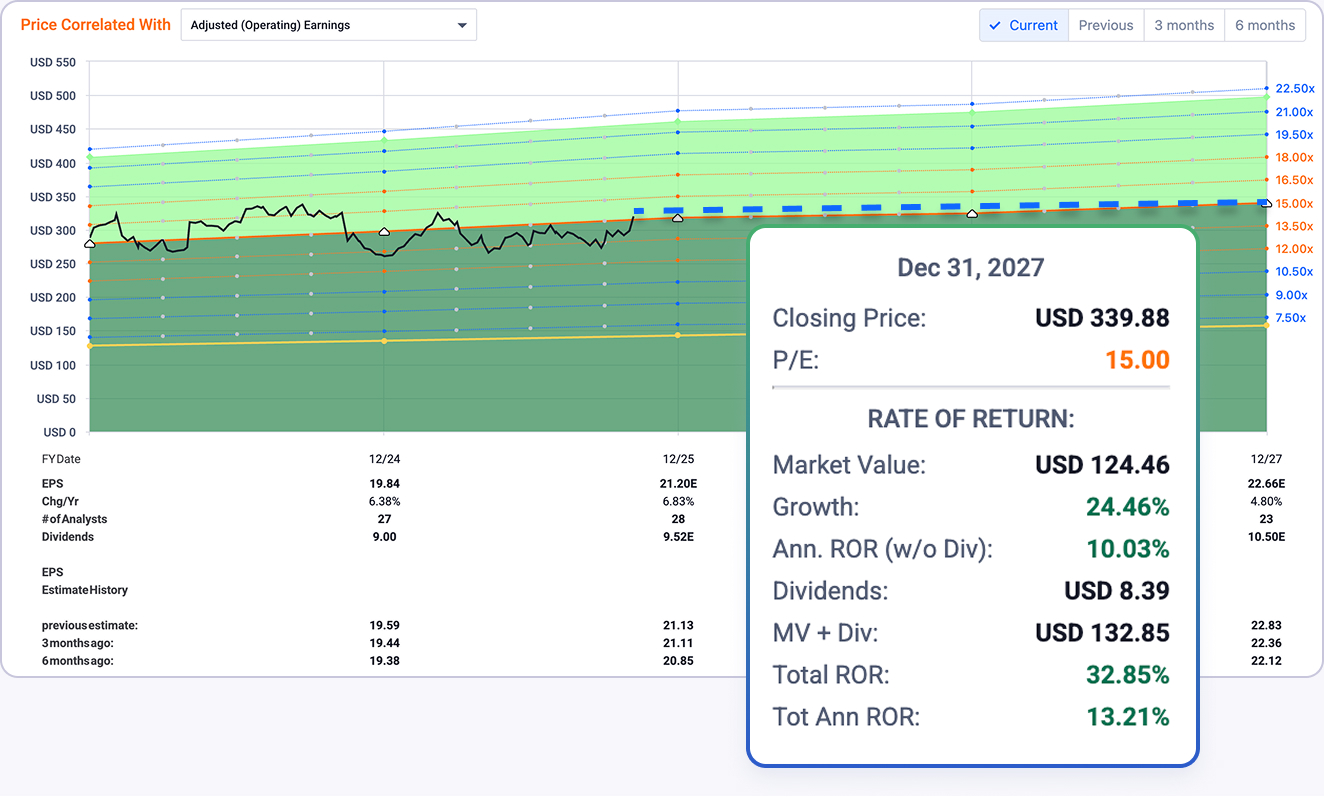
View analyst expectations directly on the chart to see how future performance could affect valuation. FAST Graphs helps you separate optimism from realism so you can invest with discipline and confidence in your long-term convictions.
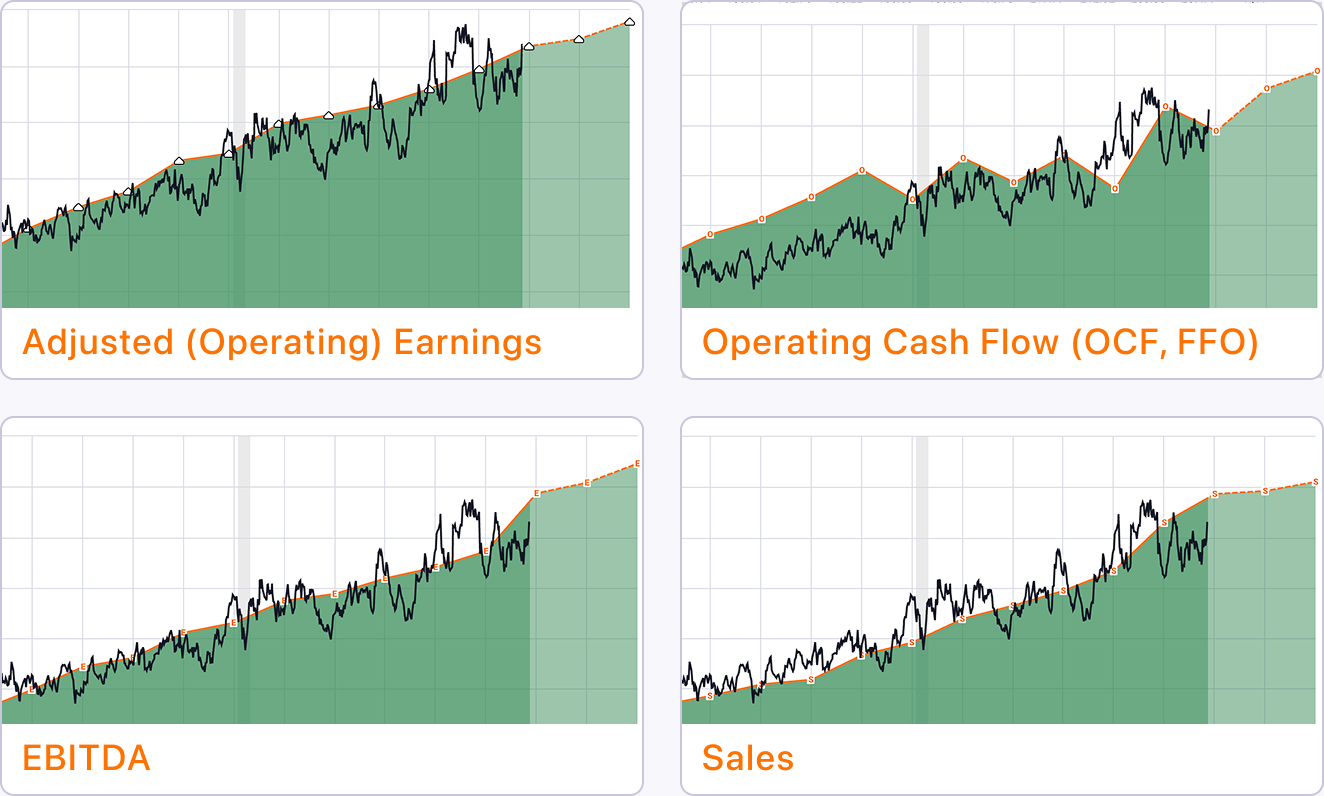
Visualize how earnings, cash flow, and sales connect to long-term market value. Switch between valuation metrics to test how the market has rewarded or punished performance and identify where opportunity may lie.
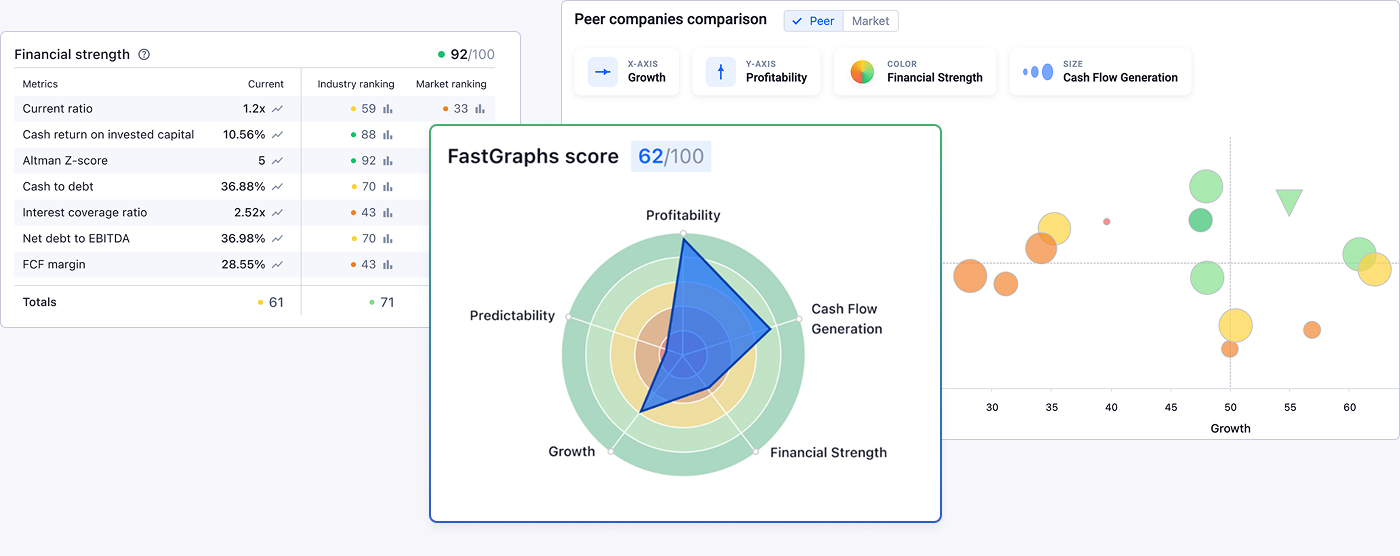
The FG Score™ distills a company’s most important financial fundamentals into a single, easy to understand score so you can quickly assess business quality without losing depth or transparency.
By organizing dozens of financial metrics into a structured, rules based framework, FG Score helps you focus on what matters most. Instead of sorting through pages of raw data, you can immediately see where a company is strong, where it may be weaker, and how balanced its overall financial profile really is.
FAST Graphs helps investors think in decades, not days. By visualizing fundamentals, valuation, and performance together, it brings reason back to the investing process. Whether you are studying a company’s history or projecting its future, FAST Graphs turns data into understanding and understanding into disciplined decision making.
GET STARTEDThe FAST Graphs stock screener helps you uncover quality companies with strong fundamentals. Filter by growth, valuation, and profitability to find businesses that are worth owning, not just trading.
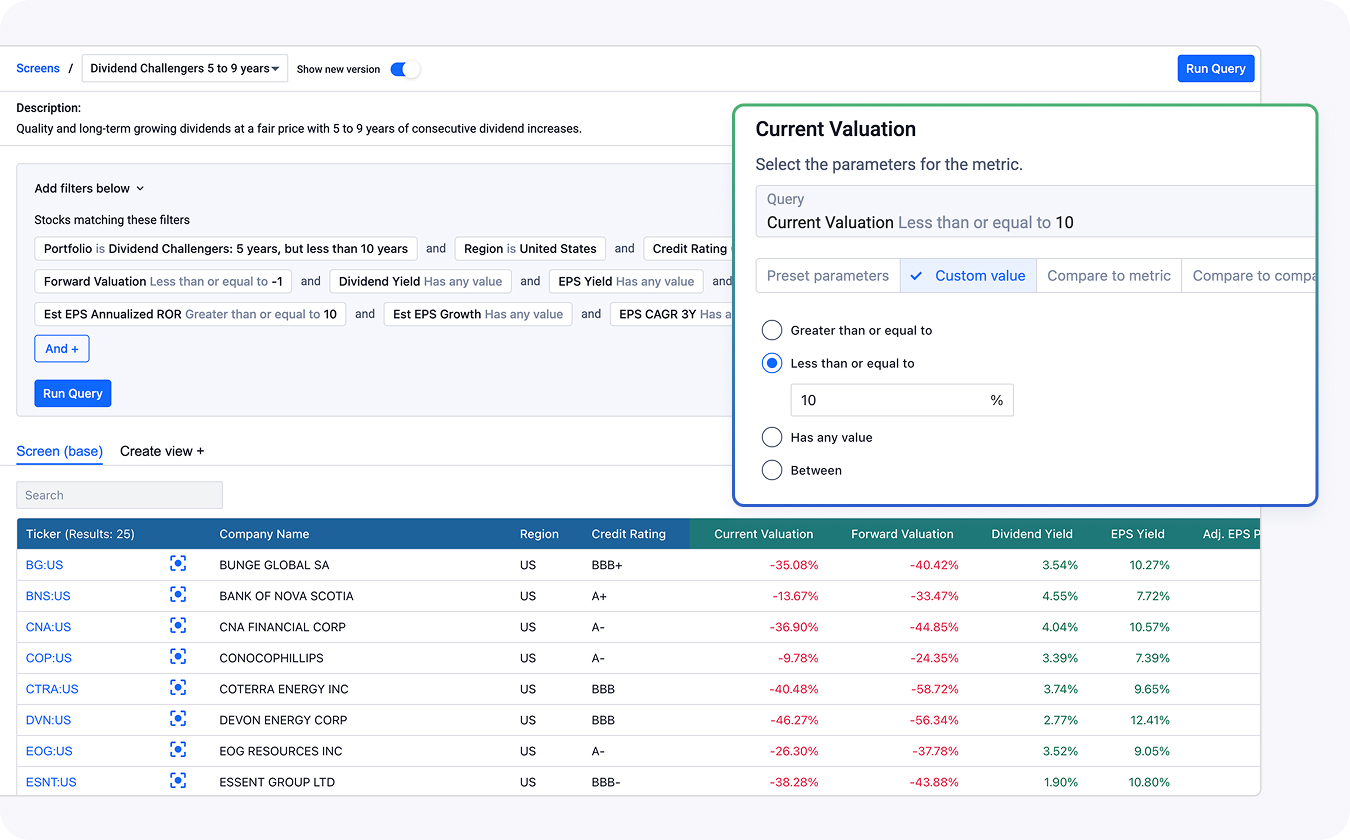
Start with professionally designed screens built by the FAST Graphs team, each focused on companies with strong fundamentals, consistent earnings, and attractive valuations. These presets help you discover quality opportunities immediately, without needing to build from scratch.
Customize your own screens using powerful comparative filters. Analyze valuation, growth, and profitability by comparing metrics like the current P/E to a company’s 5-year average, or by finding stocks with estimated growth rates greater than industry leaders such as Johnson & Johnson.
Incorporate analyst data directly into your screening process. Filter companies based on projected growth and long-term analyst accuracy to focus on businesses with reliable expectations and a proven track record of meeting forecasts.
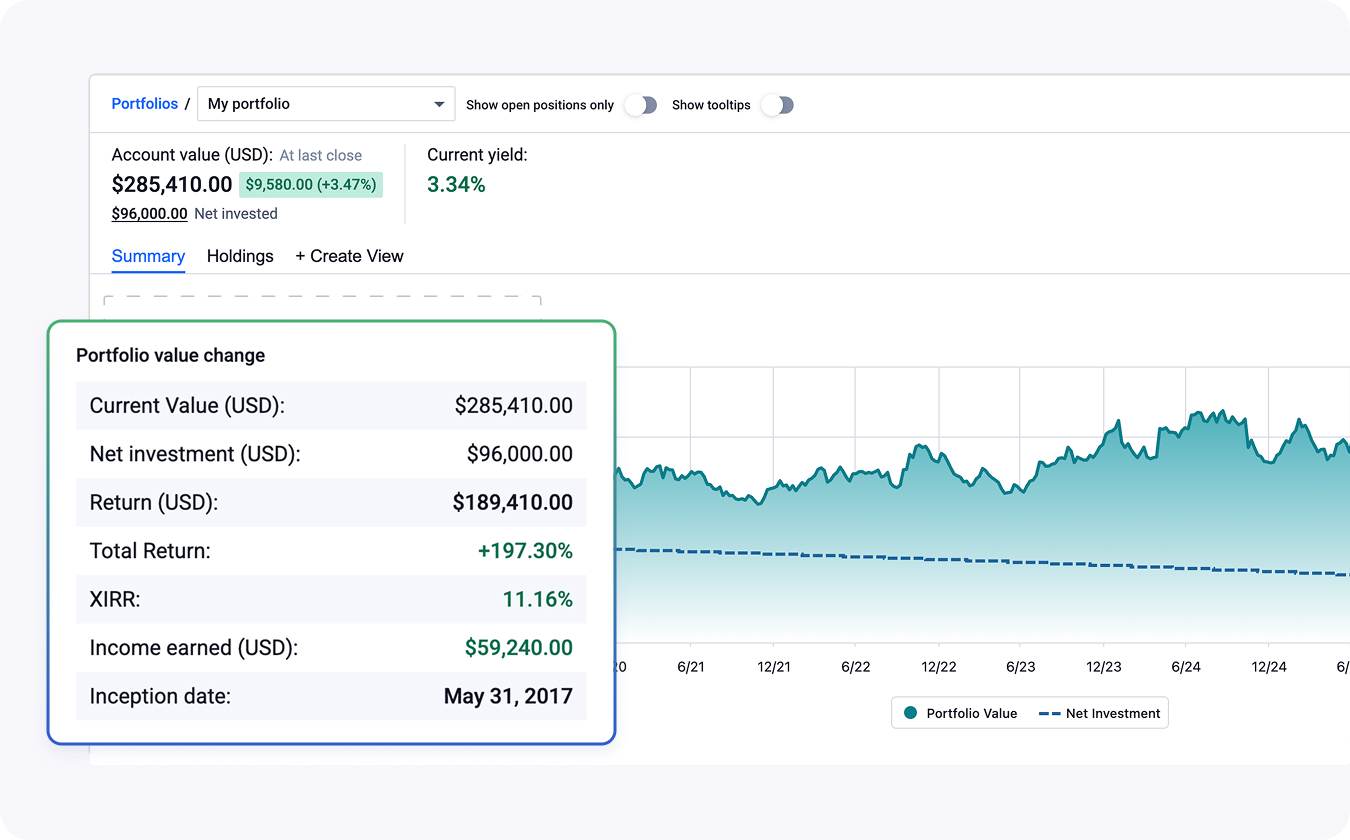
The FAST Graphs Portfolio tool gives you powerful insight into your equity investments. Track performance, income, and diversification with clear analytics that connect seamlessly with the Research Terminal for deeper stock market analysis.
The FAST Graphs Portfolio Analyzer keeps your focus where it matters — on fundamentals. Track your holdings through the lens of valuation, seeing how your investments align with fair value and long-term earnings power instead of short-term price movements.
See your top gainers, laggards, and most active positions, then view each one directly on the FAST Graphs Historical chart with your buys, sells, and cost basis overlaid. Instantly understand not just how your portfolio performed – but why.
Your portfolio is fully integrated with FAST Graphs research tools. Open a snapshot of any holding without leaving your portfolio to explore earnings history, forecasts, and valuation metrics. Measure results through the same disciplined framework that guides every FAST Graphs analysis.
From beginners to seasoned investors, our users share how FastGraphs helps them invest with confidence and clarity.
“Ever since I became a subscriber to Fast Graphs, it has helped me to become a better investor. I don’t rely on Fast Graphs exclusively, but I consider it a ‘core’ tool that I use in my approach. I realize the general market environment has been pretty good for the last umpteen years, and that certainly helps. But, were it not for Fast Graphs, no doubt in my mind I would not have done nearly as well as I have.”
“Very satisfied user of F.A.S.T. Graphs here! I would like to point out to all those who are not retired investors, this strategy can (and in my opinion, should) be used as well as part of your investment arsenal. It is certainly a large portion of mine!”
“I have been a subscriber for some months. I want you to know FAST Graphs have become invaluable to me. I am an experienced chartist. FAST Graphs allow me to do fundamental analysis by looking at a chart. You have saved me from quite a few bad decisions. Thank you so much!“
“Thanks for all the work you put into providing us with very understandable information (not to mention Fast Graphics … my favorite tool).”
“The longer I use and learn about FAST Graphs the more I appreciate them as an incredible investment tool.”
With FAST Graphs, you gain access to innovative tools designed for value investors built on top of premiere, institutional-grade financial data.
Get startedFAST Graphs™ is a stock research tool that empowers subscribers to conduct fundamental stock research deeper and faster than ever before.