Make safer and more profitable Investment decisions
Everyone wants to know when to buy, sell, or hold a stock. FAST Graphs reveals this by clearly illustrating the value of the business relative to its stock price.
Become a better investor with FAST Graphs
Investing in good businesses is key to above-average returns, and FAST Graphs helps you identify those businesses faster than ever before. Simple, but interactive, charts quickly let you identify valuation so you know when to buy, sell, and hold a stock.
How it works
Quickly know when to buy, hold and sell stocks correctly
This stock is Undervalued
The shares are undervalued, since the company’s income (orange line) is significantly higher than the current value of the shares (black line), it suggests the price should rise.
This stock is Fairly valued
When stocks are fairly priced (the black line is close to the orange line), consider maintaining your positions or even buying more. Buying at this stage still represents a great investment.
This stock is Overvalued
The company here is significantly overvalued, shown by the black line being much higher than the orange line. Owning shares here have considerably more risk of losing capital. Consider harvesting gains and reducing your positions.
Our solutions
Investing isn’t easy, but a tool like FAST Graphs assists in the process – for beginners and professionals
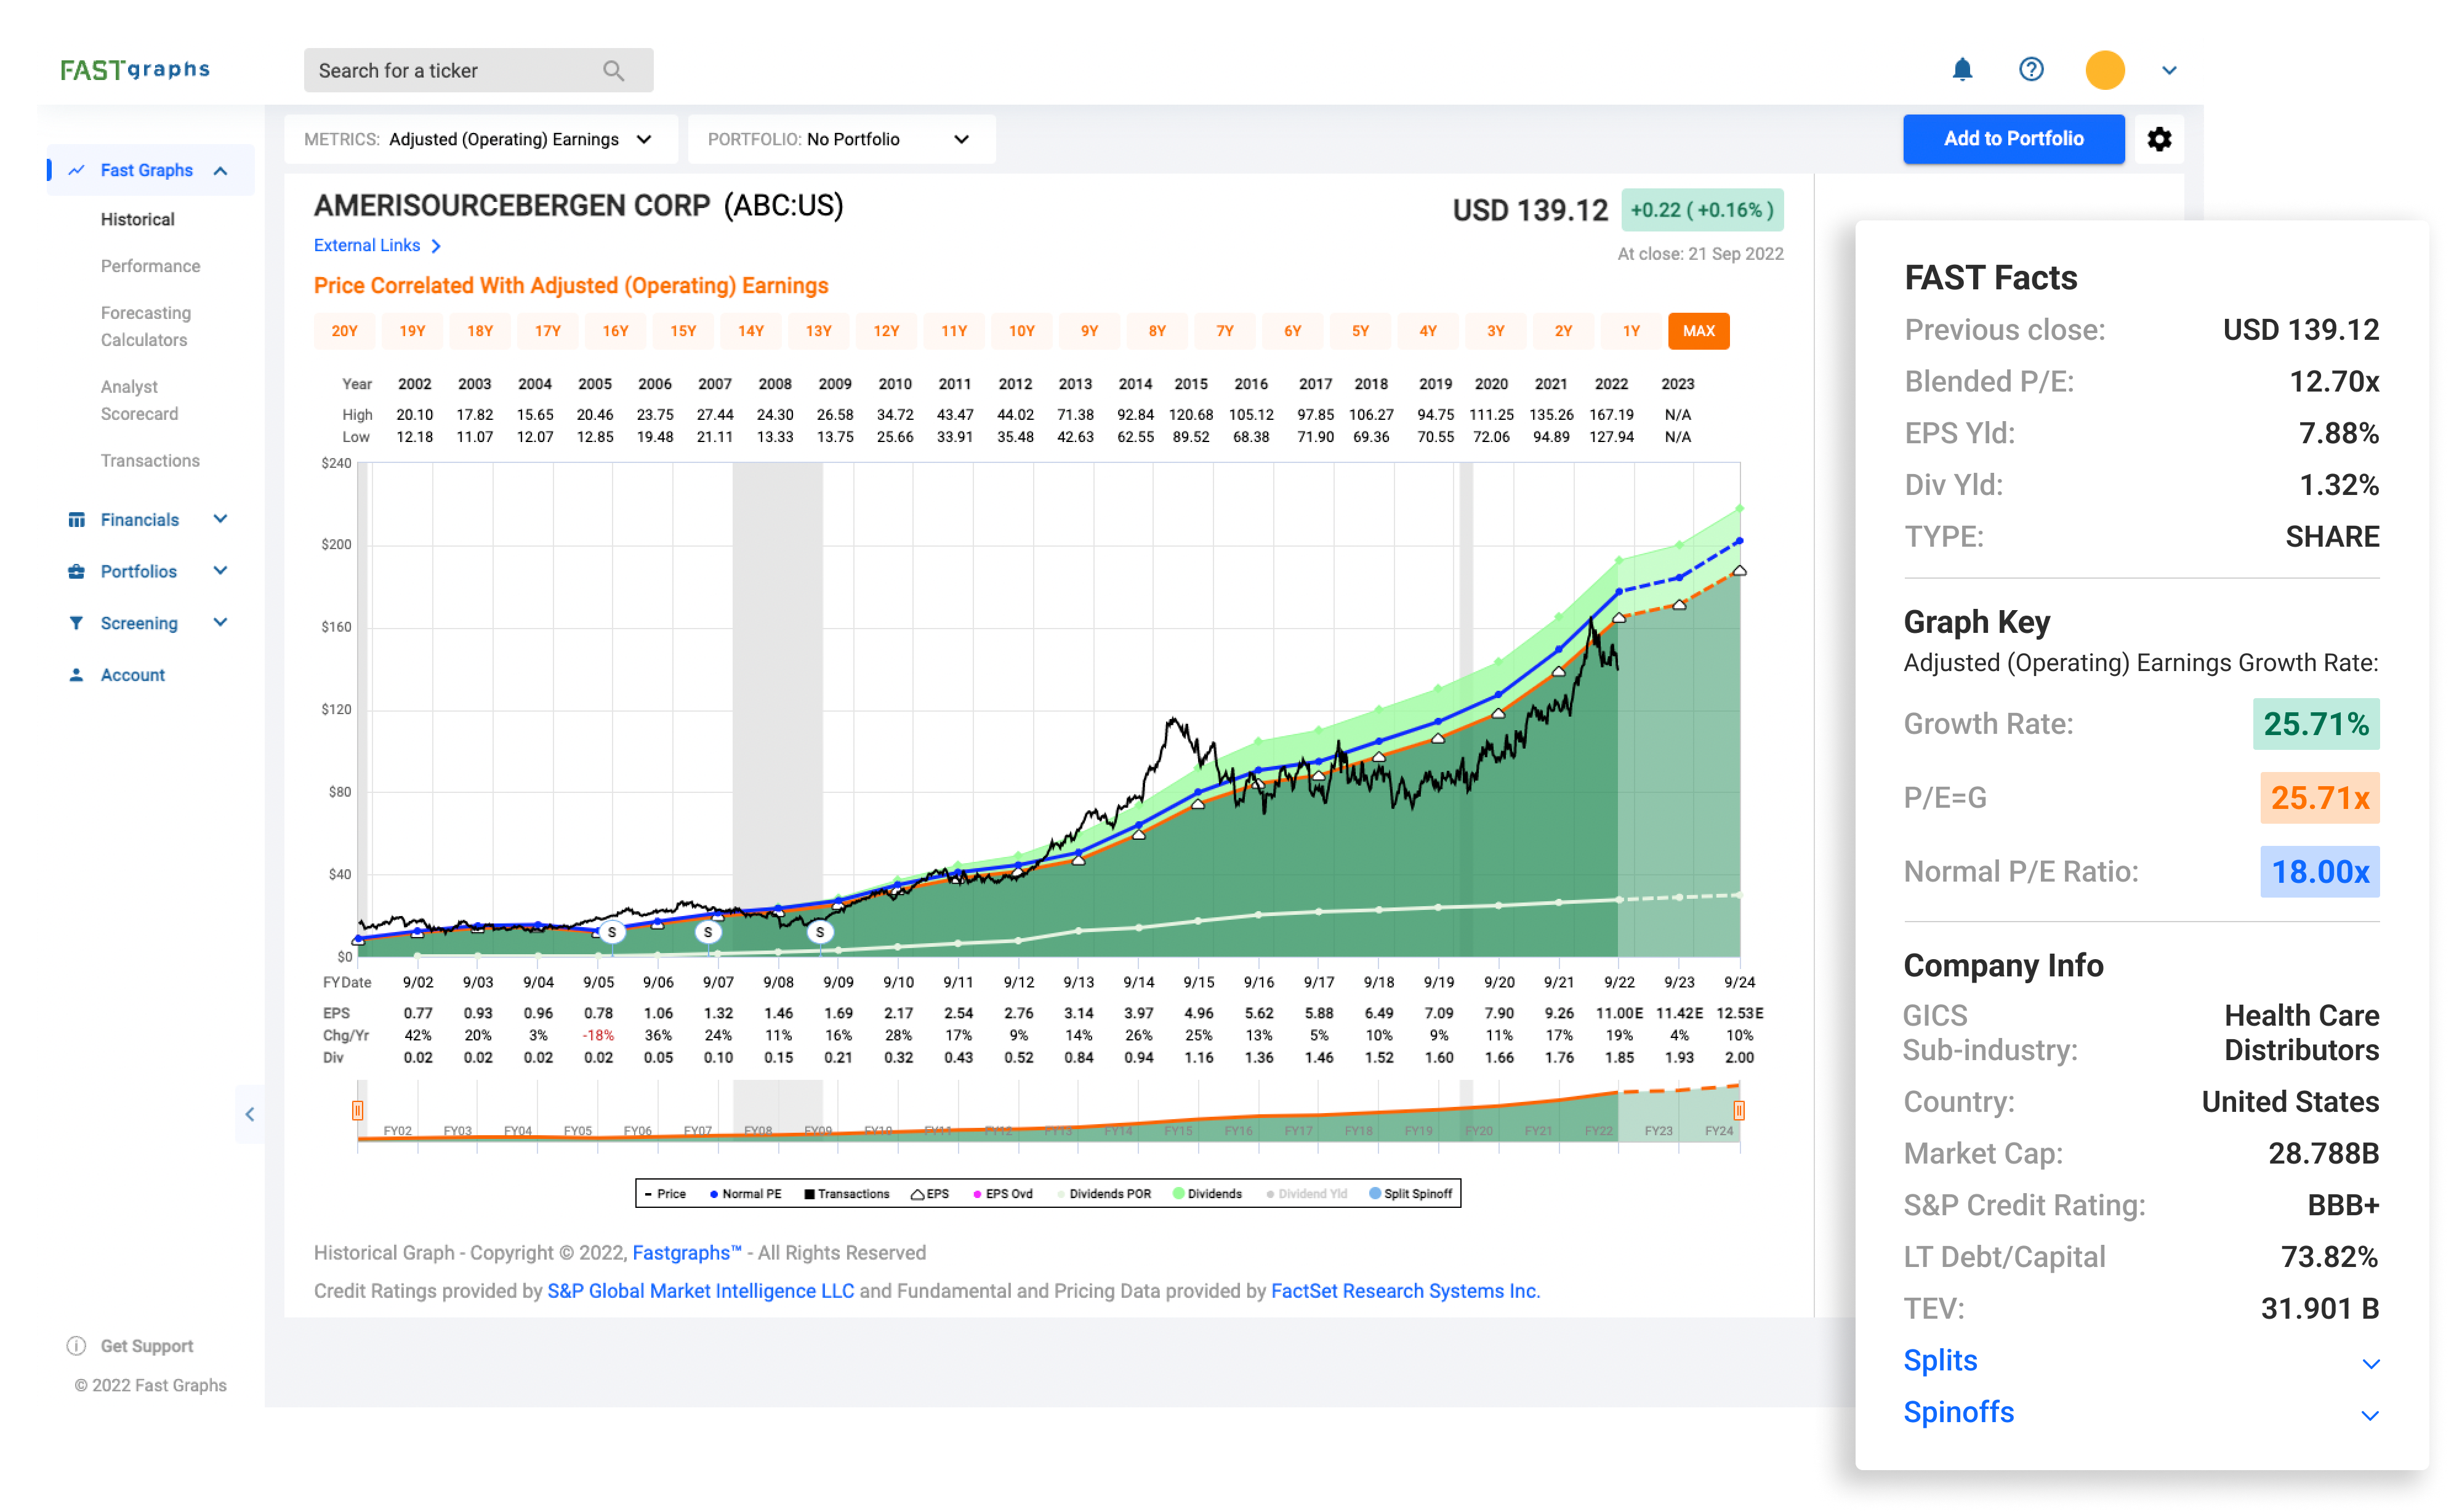
Visualize the relationship of operating results to stock price performance on thousands of companies.
Learn more about FAST Graphs
Dive deep into company financials to help get an understanding of the numbers behind a company. You’ll have access to full financial statements and powerful graphing features to help you uncover data.
Learn more about Financials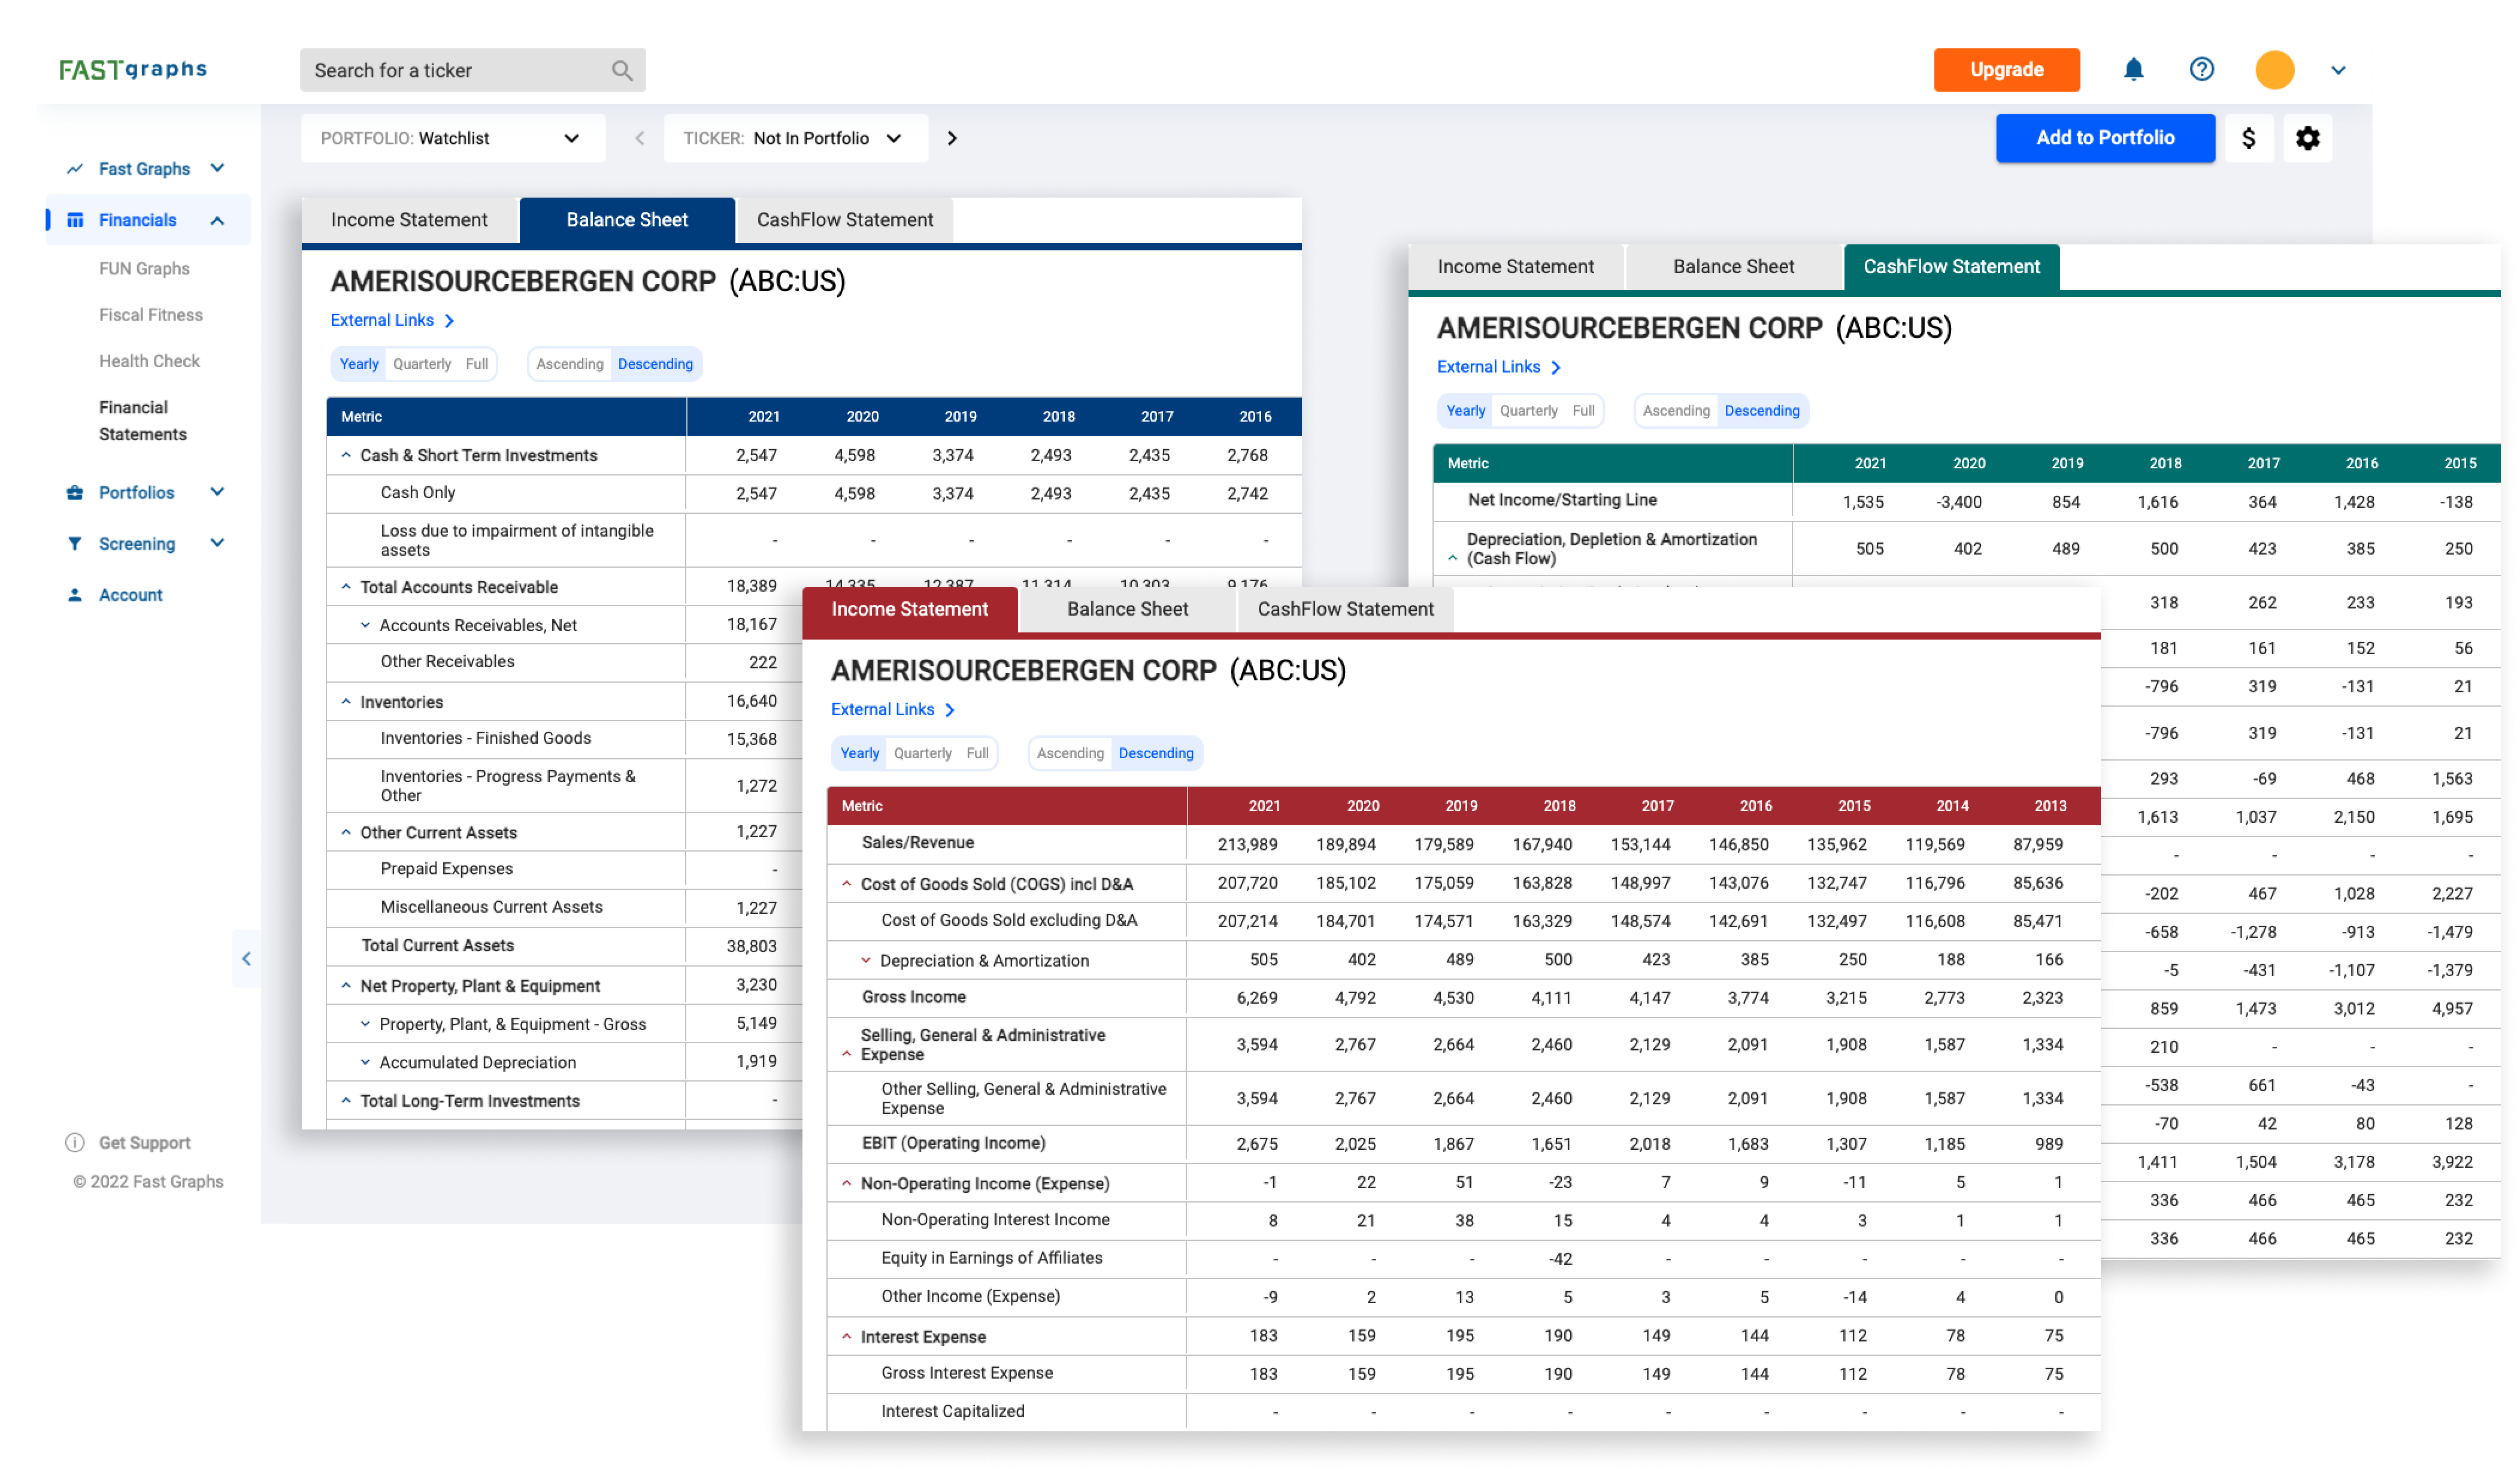
Create watchlists, track your investments, and create different views to understand the data within your portfolios.
Learn more about Portfolios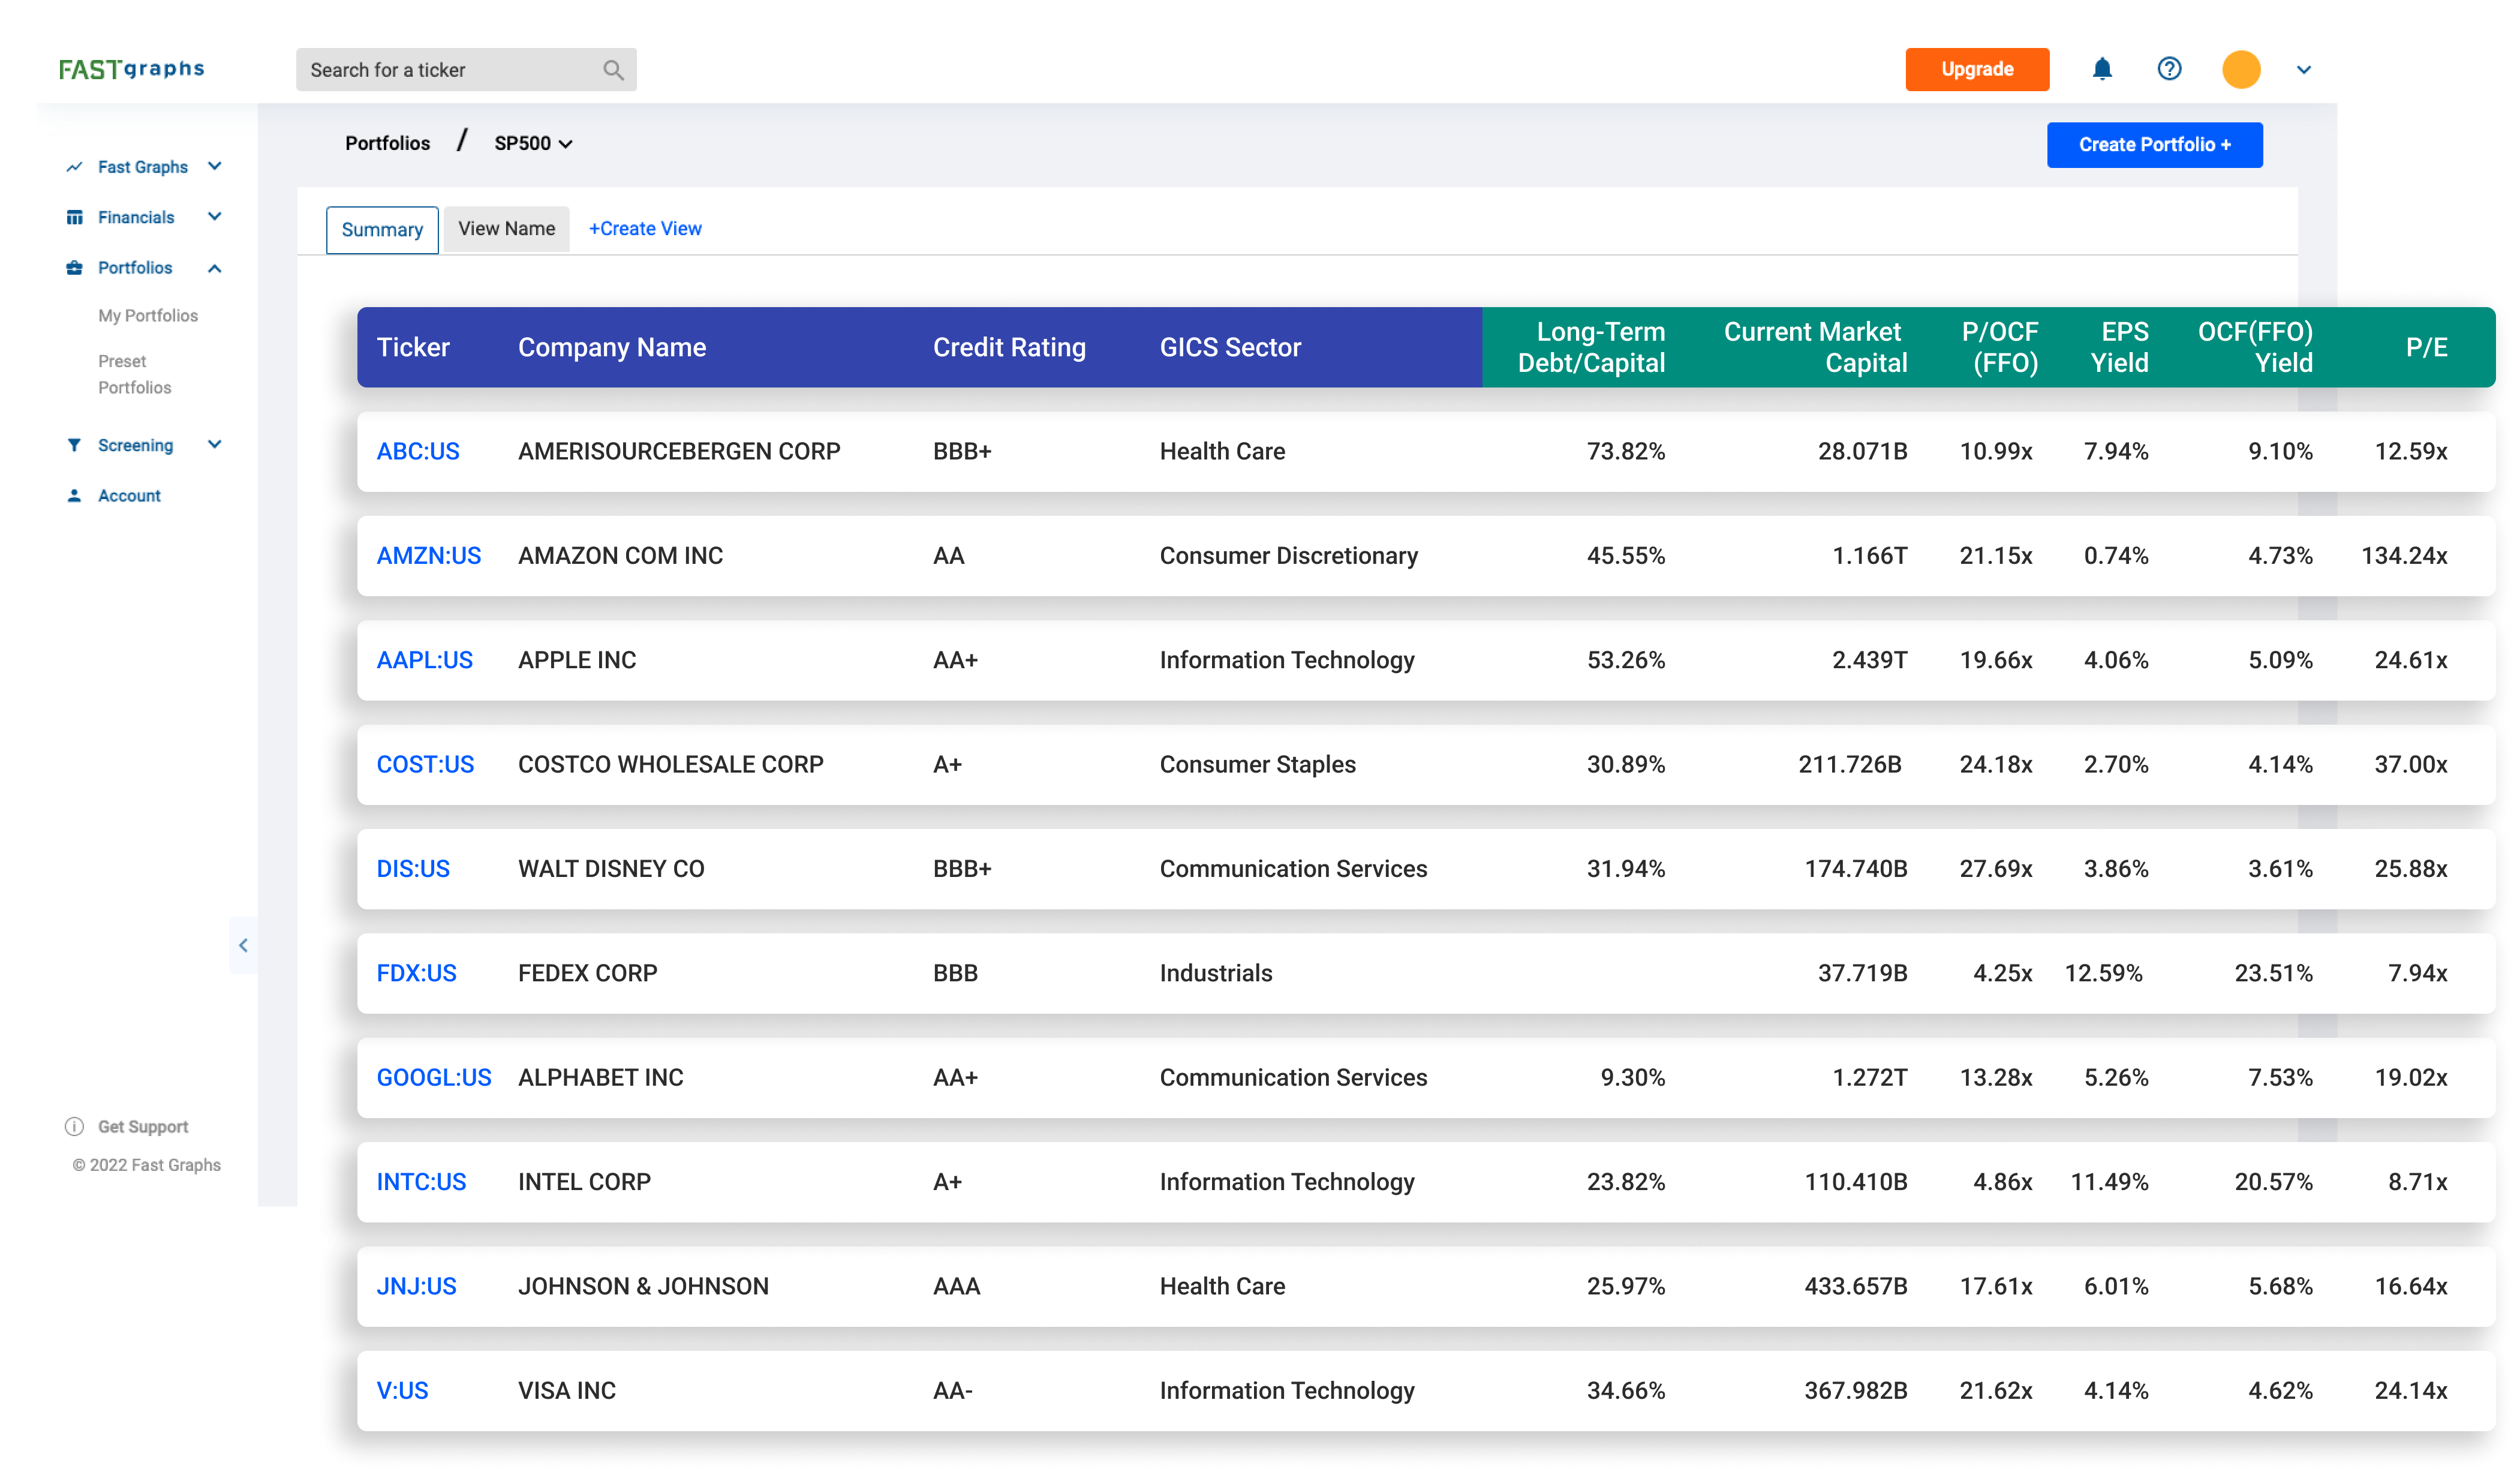
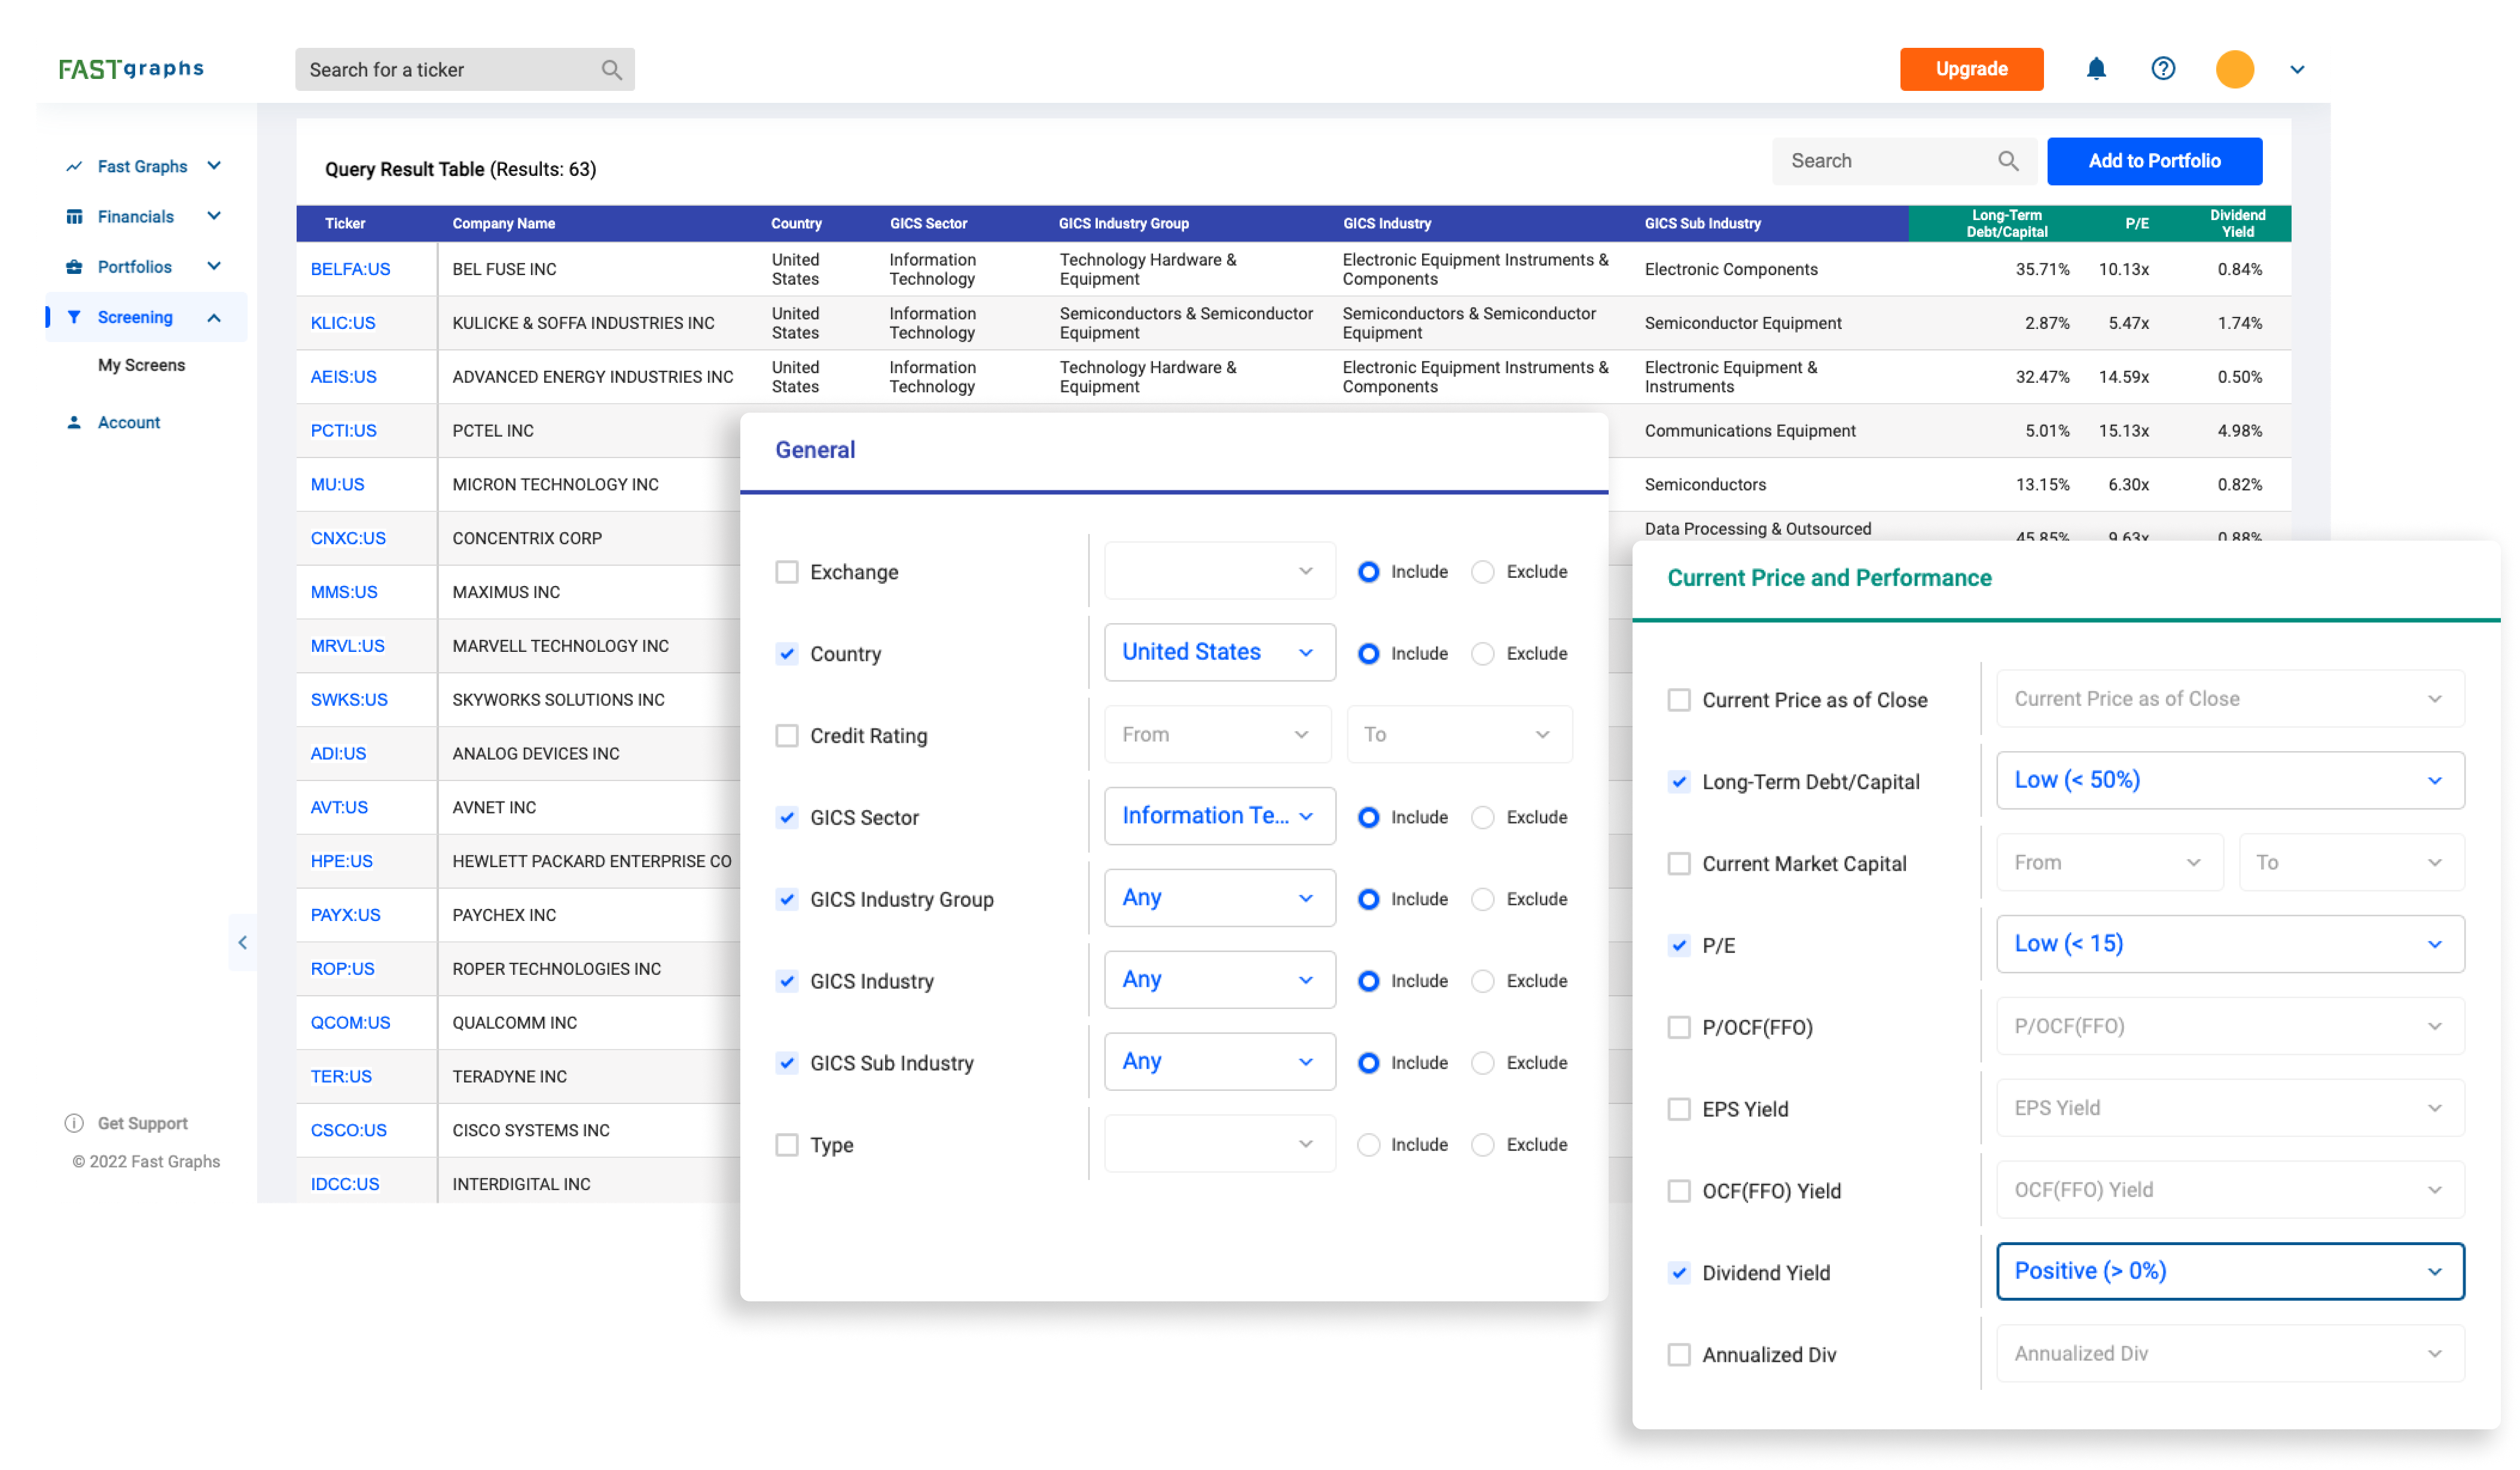
Create custom screens from 18,000+ stocks to research candidates and export to new or already built portfolios.
Learn more about Screening