Introduction
Today Investors are keenly focused on income while simultaneously very risk averse.This current behavior brings with it a level of frustration.The appetite for yield is high precisely at a time when yields on the traditionally safest investments like bonds and CDs, etc. are at historic lows.On the other hand, dividend yields on many blue-chip stocks are close to double what investors would normally find with this asset class.
In many cases, these abnormally high yields are purely a function of historically low valuations. Ironically, the only logical reason that we can identify as to why valuations of blue-chip stocks are so low is fear (risk aversion).
The Many Faces of Risk
In truth, the concept of risk is a multifaceted subject.Yet investors and writers often throw the word around as if it had a single or universal meaning.In reality, there are many faces to risk and prudent investors need to consider and evaluate them all before making investment decisions.Of course the most obvious risk, and perhaps the one that investors fear most, is loss of principal, total or even partial.
The great recession of 2009 heightened investors’ focus on this area of risk. This anxiety regarding loss has persisted even after two years of healthy gains and recovery for equities in general. Therefore, we offer the following admonition; it would be imprudent to ignore the other faces of risk by excessively focusing only on fear of loss.
The concept of risk is too vast to be covered in one article.Therefore, we will limit our discussion by covering only one additional aspect of risk that we feel is of great importance.Purchasing power risk is one area of concern that we feel has not recently been given the attention it deserves.Money flooding into low yielding treasury bonds provides evidence for this statement.
Investors are so concerned with protecting the nominal value of their principal, that they expose themselves to the ravages of their purchasing power by inflation. More simply stated, it’s not enough to merely maintain purchasing power today, it’s also imperative to prudently grow purchasing power over time as well. This means increasing both the income and principal components of your portfolios.
Fortunately, the awareness behind the need for both growth of principal and income appears to be building.More and more the investment community is offering articles and discussions about dividend paying common stocks. However, with valuations of many blue-chip dividend paying stalwarts still at historically low valuations, the level of awareness is nascent.
Even though we are encouraged by this growing awareness, we caution that balance must also be maintained. The tug-of-war between investing for growth versus investing for income needs to be properly executed. Otherwise, the investor’s portfolio is at risk of falling into the mud (there’s that word risk again).
The pharmaceutical industry appears to offer a fertile field of opportunity for investors seeking growth of principal and growth of income.Valuations look low and therefore, yields are higher than normally expected for this once high-growth sector.But investors need to keep in mind that investing is a dynamic process where the fortunes of individual companies, and even of complete industries, can rapidly change.
Sometimes this occurs as a result of disruptive technologies. Examples would include: Henry Ford and the buggy whip, the Internet and the newspaper industry, and numerous others. Additionally, the fortunes of an industry can face political hurdles (i.e. healthcare reform), and sometimes markets can simply become saturated (i.e. autos and electronics). These are only a few of the reasons why the prospects of an industry or sector can rapidly change. In many ways, the healthcare sector may be facing them all today.
In this article we are going to look at big Pharma through the lens of our F.A.S.T. Graphs research tool. One of the real advantages that our tool offers is the ability to easily review different time frames. We can use it to look at any historical period, for example, 1992 to 2001. One of our favorite exercises when initiating research on a company is to start with a 20 year (our maximum available) historical price and earnings correlated F.A.S.T. Graphs followed by a 15 year, then a 10 year, then a 5 year, etc.
With this exercise we can determine whether growth is accelerating, decelerating or staying the same. We feel this is valuable information to have. For illustration purposes we will offer various F.A.S.T. Graphs over different time frames on our first example Merck & Co. (MRK). Due to space constraints for the remaining companies, we will only provide two historical price and earnings correlated F.A.S.T. Graphs with accompanying performance.
Several beneficial side effects of this analysis will be to provide illumination on the importance of the following three critical investment concepts: 1. Earnings and earnings growth, 2. Dividends and dividend growth, and 3. True Worth valuation-over or under. Our objective is to utilize the research tool to illustrate the effect that each of these metrics have on long-term shareholder returns.
The graphs will show that the rate of change of earnings growth will be the primary determinant of investor returns and the level of dividend income. However, the graphs will further demonstrate how overvaluation will reduce returns and how undervaluation will enhance returns. Consequently, we urge investors to carefully consider each of these three important metrics.
Merck & Co. in the Rearview Mirror
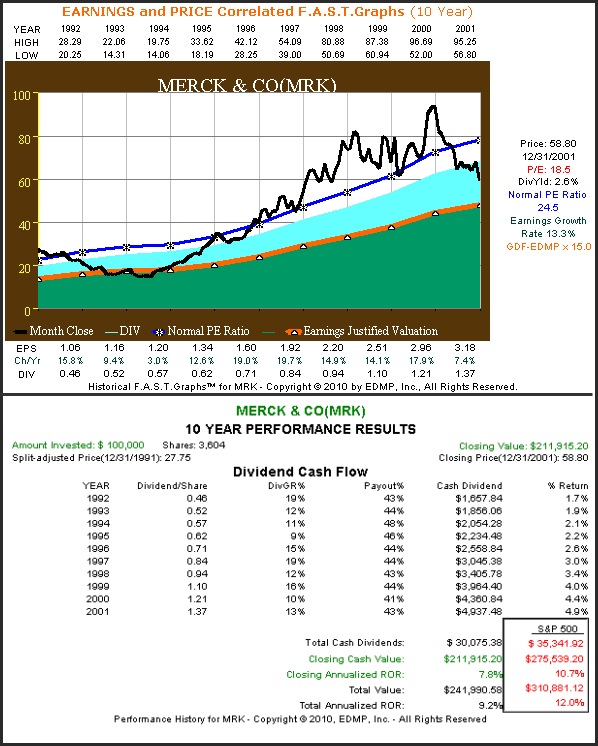
Our first historical price and earnings correlated graphs and accompanying performance results will look at Merck & Co. (MRK) covering the period 1992 to 2001. This was an era where Merck built its reputation as a consistent, above-average growth stock. Merck’s operating excellence and price performance was a poster child for an industry that was considered resilient, if not immune, to economic cycles.
As our population aged, demand for pharmaceuticals was inelastic and compounding at a rapid rate. New product launches with patent protections created numerous blockbuster offerings to profitably feed the insatiable appetite of an aging population.
During this golden age of branded pharmaceuticals, Merck was able to consistently grow earnings in excess of 13% per annum. The stock market liked these consistent results and often richly valued Merck’s shares far in excess of their earnings growth rate, except for a brief time in 1993 and 1994. The normal PE ratio (blue line with asterisks) averaged 24.5 but often exceeded this high level. Dividends followed earnings and were increased every year consistent with the growth of earnings.
A couple of interesting takeaways from the graphs on Merck are how a high starting valuation followed by a lower ending valuation over this time frame led to underperformance versus the S&P 500. But most importantly, we draw investors’ attention to the consistent and high earnings growth the company achieved.
Merck: The Golden Age 1992-2001
(Click to enlarge)
Merck: Minimal Growth Migration 2000-2010
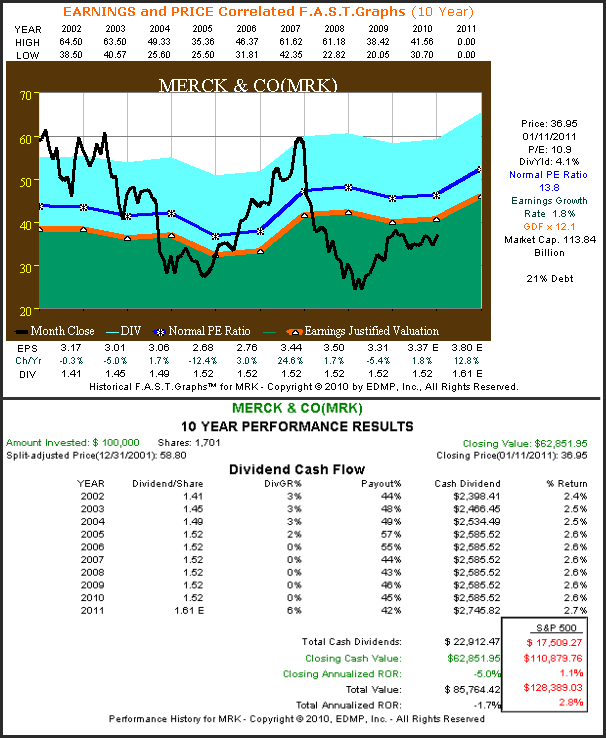
Calendar years 2000 through 2010 show a very different Merck than what we saw in the preceding decade.The earnings growth rate not only slowed dramatically only averaging 1.8%, the consistency of their earnings performance also suffered greatly over this time.
Consequently, the stock markets once penchant for richly valuing Merck’s shares dissipated and their normal price earnings ratio (blue line with asterisks) was almost cut in half to 13.8. Furthermore, in stark contrast to the previous decade their stock price was below a PE of 13.8 as much or more than it was above it. Its current PE ratio of 11 resides on the low side of historical norms, even during this slow growth era.
Nevertheless, many still think of the Merck of old when considering investing in this blue-chip pharmaceutical giant.The 4.1% current dividend yield and low debt to equity ratio of only 21% appear very attractive.However, we remind the reader that future growth of earnings going forward will determine the future level of dividends.
Note that Merck’s dividend has not increased since calendar year 2005. Also, the estimate for 2011 is simply a mathematical calculation and should not be relied upon. Furthermore, also understand that the estimated dividend for calendar year 2011 is not included in the total cash dividends paid column on our graphs.
(Click to enlarge)
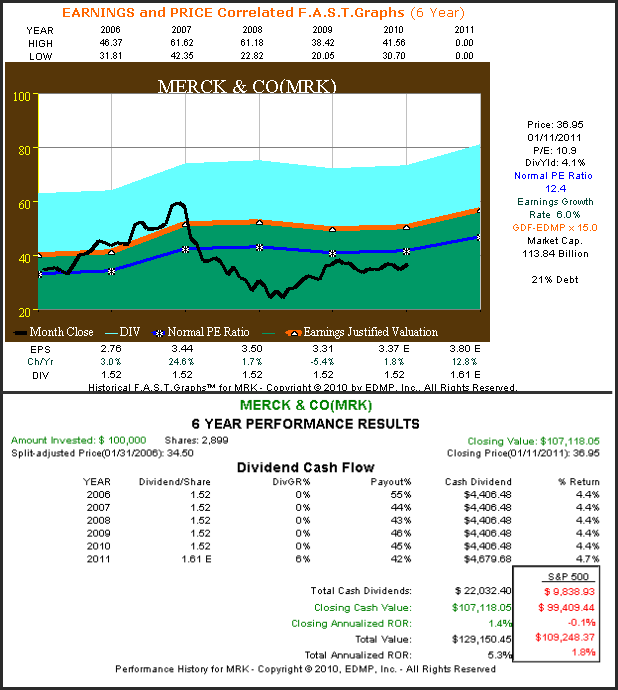
With our final historical price and earnings correlated F.A.S.T. Graphs and accompanying performance results on Merck we will shorten our review to cover only the last five years (note that our graphs always include one year of forecasting). Several interesting factors come into play. First, we find that Merck & Co.’s earnings growth rate has averaged 6% per annum since 2006.
Also, we see that valuation has been more reasonable so that principle was at least maintained even though ending valuation is slightly less than beginning was. But perhaps most interestingly, we clearly see the importance of dividends as they represented the bulk of shareholder returns since 2006.
(Click to enlarge)
Analysis: BMY, LLY, PFE, GSK, NVS
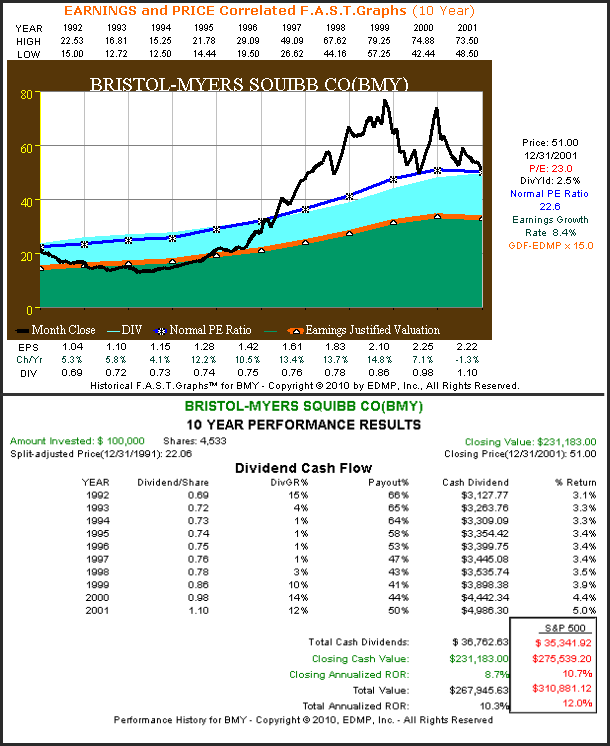
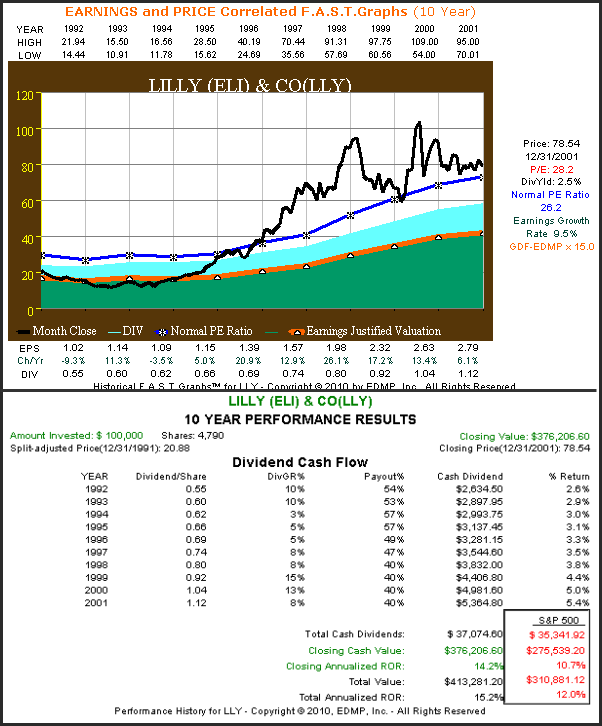
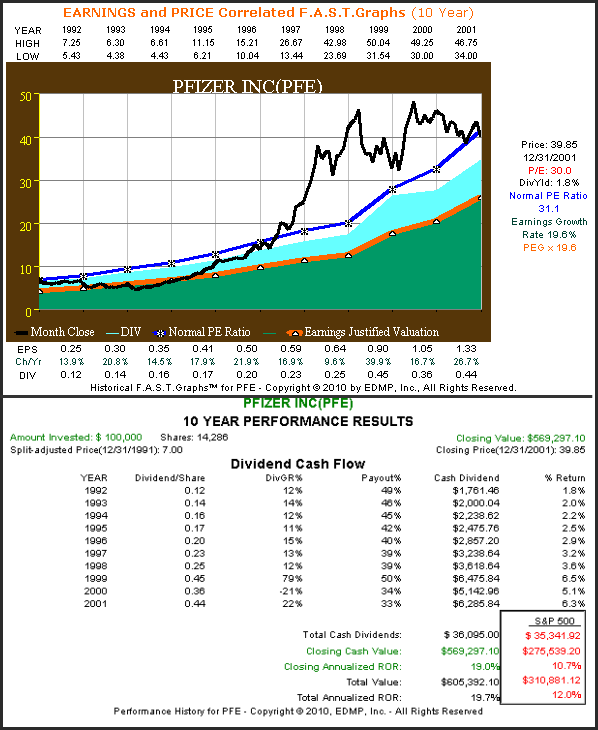
On each of the five following major players in big Pharma we will provide historical price and earnings correlated F.A.S.T. Graphs with accompanying performance over two distinct time frames. First we will look at each company over the years 1992 to 2001. The first three examples will include Bristol-Myers Squibb & Co. (BMY), Eli Lilly & Co. (LLY) and Pfizer Inc (PFE). What you’ll see is a pattern of consistent above-average earnings growth for each of these companies from 1992 to 2001.
However, our fourth example, GlaxoSmithKline PLC (GSK), will show consistent but lower growth than the first three. Finally, our fifth example Novartis AG (NVS) was created by the merger between Sandoz AG and Ciba-Geigy AG in December 1996.
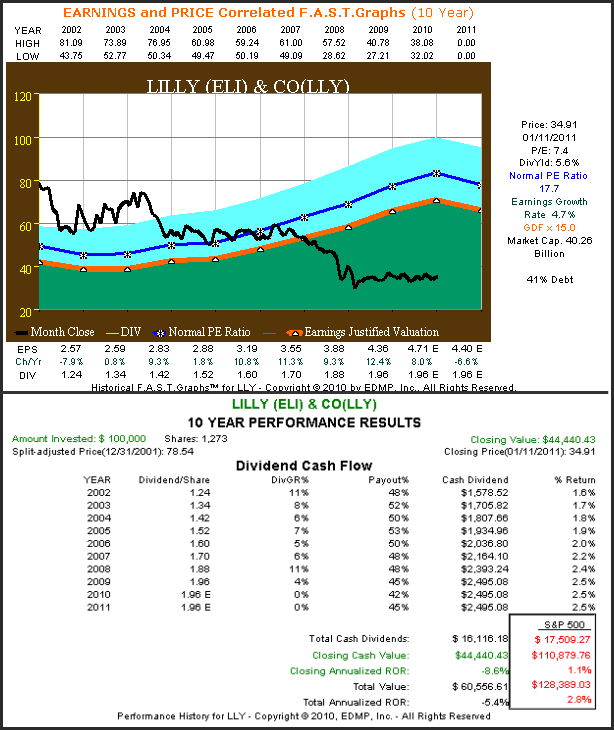
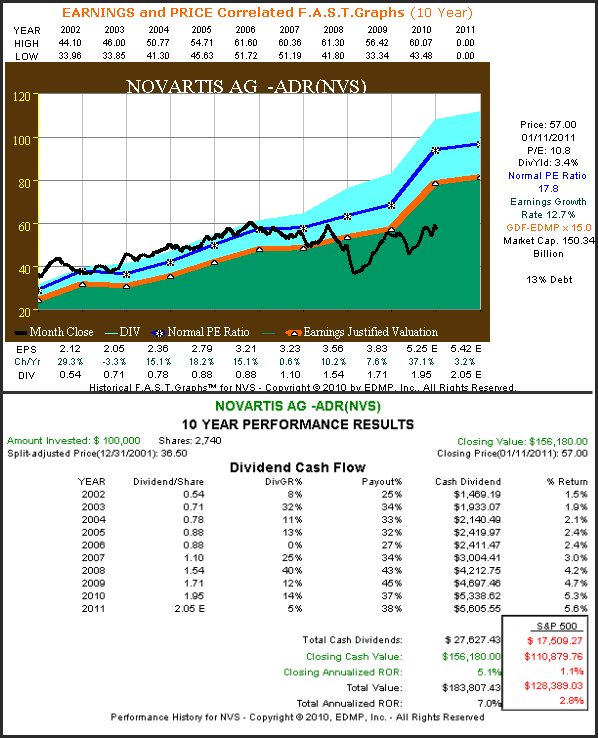
Our second time frame will cover the more recent historical period 2002 to 2011. As we saw with Merck & Co., four of these five companies will show much lower rates of earnings growth and more cyclicality over this more recent time frame. Novartis AG will be the only exception thanks to their strong generic business (Sandoz-17% of sales) and a more diversified business model. Interestingly, Novartis AG also has the lowest dividend yield of the group and the only one that is below 4%. May we also suggest that you focus on the three critical factors mentioned above as you review each of these historical graphs.
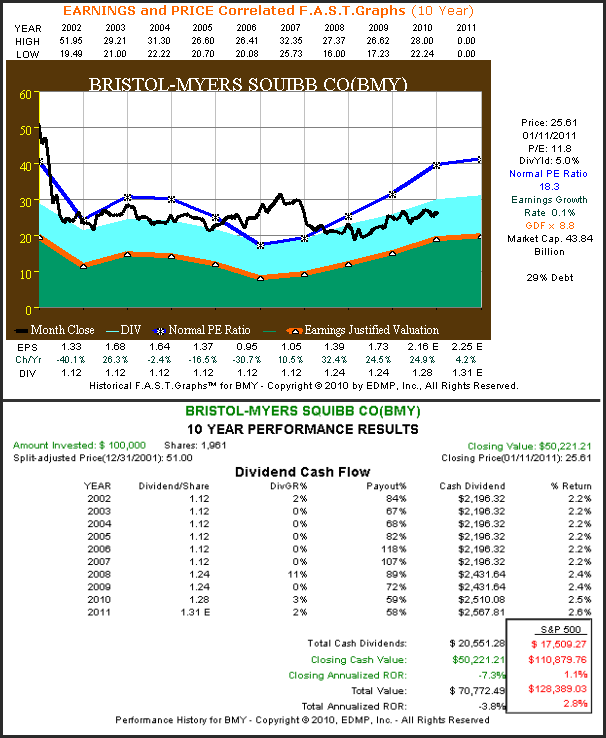
Bristol-Myers: The Golden Age 1992-2001
(Click to enlarge)
Bristol-Myers: Minimal Growth Migration 2002-2011
(Click to enlarge)
Lilly & Co.: The Golden Age 1992-2001
(Click to enlarge)
Lilly & Co.: Minimal Growth Migration 2002-2011
(Click to enlarge)
Pfizer: The Golden Age 1992-2001
(Click to enlarge)
Pfizer: Minimal Growth Migration 2002-2011
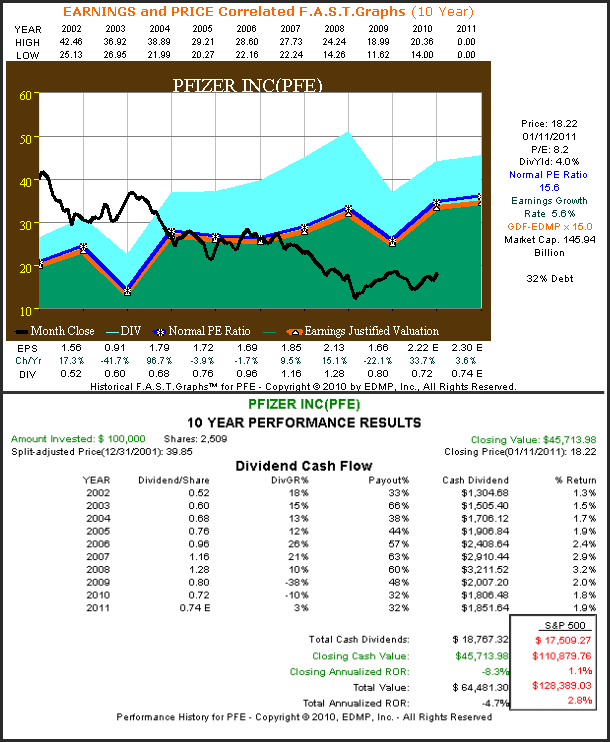
(Click to enlarge)
GlaxoSmithKline PLC: The Golden Age 1992-2001
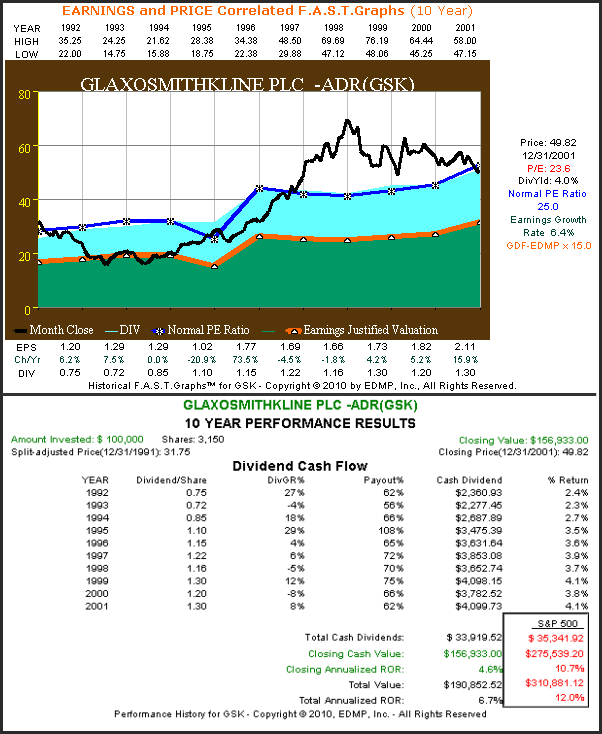
(Click to enlarge)
GlaxoSmithKline PLC: Minimal Growth Migration 2002-2011
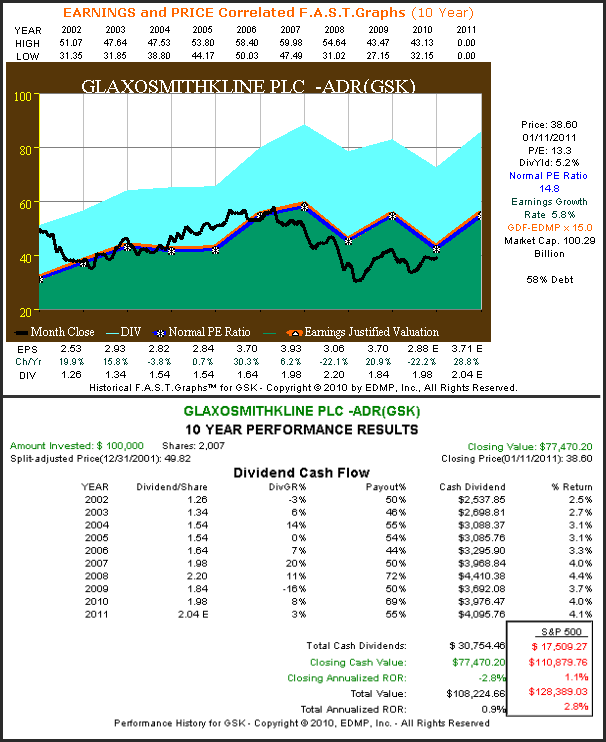
(Click to enlarge)
Novartis AG: The Golden Age 1992-2001
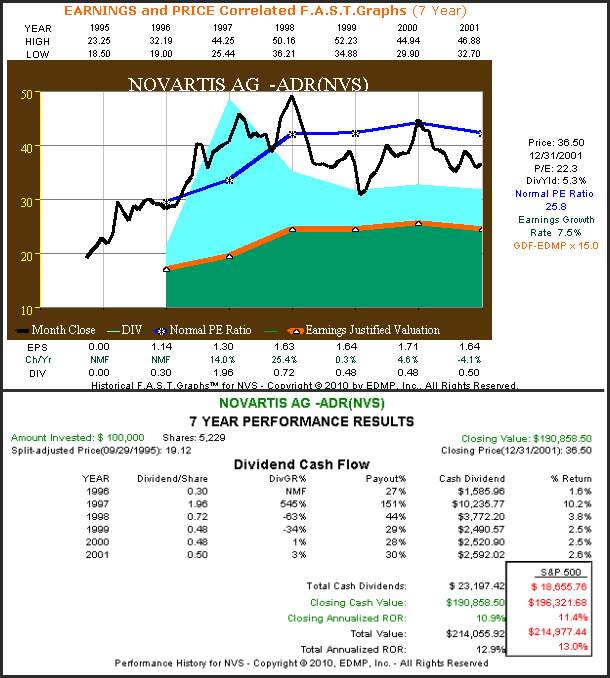
(Click to enlarge)
Novartis AG: Minimal Growth Migration 2002-2011
(Click to enlarge)
Conclusions
Some of the best dividend yields available today can be found on big pharma stocks.An equal investment in each of the six examples presented in this article would generate a combined average yield of 4.55%.This is roughly the same yield available today on a 30 year treasury bond.
Furthermore, since each of these companies are currently trading at PE ratios that are historically low relative to this industry’s norm and at an approximate 30% to up to 50% discount to the S&P 500, they would, at first glance, appear as enticing purchases. This would be especially true for investors that continue to see this industry as one offering consistent growth and steadily increasing dividends.
However, as the above historical price and earnings correlated F.A.S.T. Graphs illustrate, this industry has experienced major changes over the last decade or so. There are many reasons for this, including the belief by many that new blockbuster drugs based on chemistry are rapidly becoming a thing of the past.
Additionally, even though demographics (mainly an aging world population) should benefit this industry, many political risks to their growth exist. Also the rising cost of healthcare is placing great pressure on this industry’s traditional business model. Therefore, current consensus earnings growth forecasts are significantly lower than they were a decade or so ago.
On the other hand, with today’s high yields and low valuations even today’s muted growth may offer attractive return potential to include dividend growth. Most of the examples cited above possess good balance sheets and currently generate good cash flows. However, these companies should be evaluated based on their future potential and not their long-standing excellent reputations. The pharmaceutical industry is without a doubt an industry in transition.
Furthermore, we contend that the only logical reason that quality companies like these would trade at a PE ratio lower than the 15 PE that the S&P 500 trades at is if future earnings were expected to collapse. Remember, even a fixed no growth income stream should be worth more than these companies are being capitalized at. Therefore, more than normally, we suggest a comprehensive and thorough research effort prior to investing any money.
Disclosure: I am long NVS.
Disclaimer: The opinions in this document are for informational and educational purposes only and should not be construed as a recommendation to buy or sell the stocks mentioned or to solicit transactions or clients. Past performance of the companies discussed may not continue and the companies may not achieve the earnings growth as predicted. The information in this document is believed to be accurate, but under no circumstances should a person act upon the information contained within. We do not recommend that anyone act upon any investment information without first consulting an investment advisor as to the suitability of such investments for his specific situation.