In this article and video we are going to cover Fidelity National Information Services.
The FAST Graphs fundamentals analyser software tool represents a powerful and dynamic first step towards analysing any stock. Consequently, we rightfully refer to FAST Graphs, as a tool to think with. But more than that, FAST Graph also provides a ton of fundamental data and ratios presented in easy-to-read graphical form. Once a subscriber becomes familiar and proficient with this powerful fundamental analyser tool, most say they would not even consider investing in a stock without analysing it through FAST Graphs.
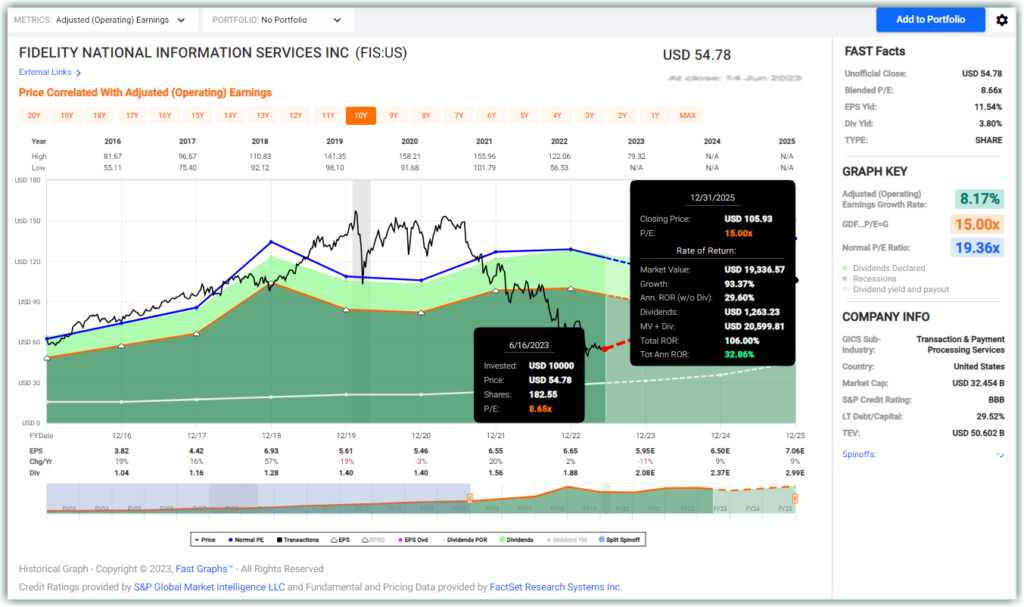
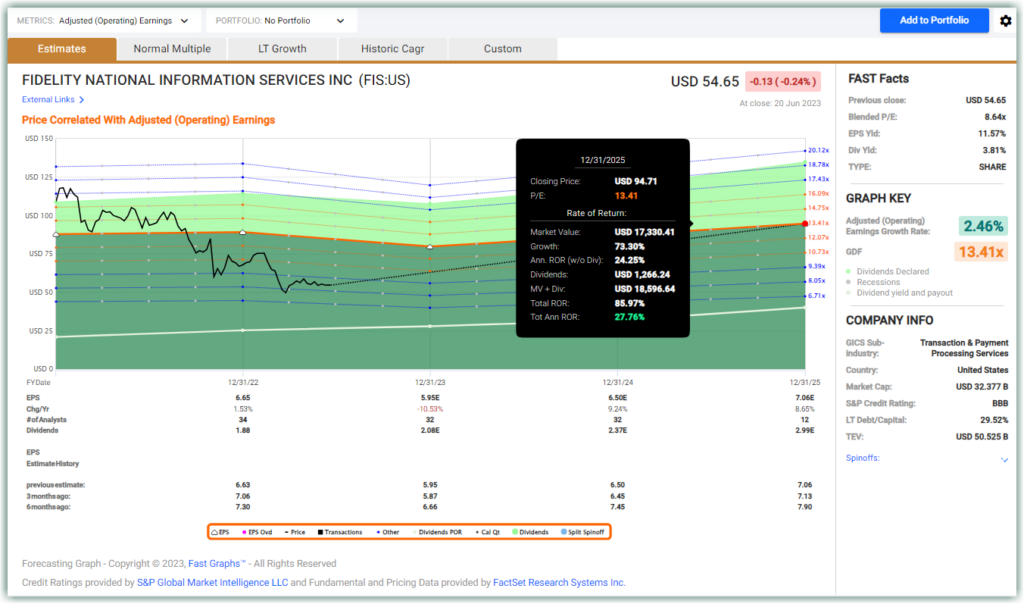
At a glance, you can see that Fidelity National Information Services (FIS) is undervalued. As of close on 14 June 2023, FIS was trading at a blended P/E of 8.66. Over the past seven and a half years, FIS had traded at a normal P/E of 19.36. Even considering the period between the Great Financial Crisis and prior to FIS’s $43 billion acquisition of Worldpay in 2019, FIS still traded at a normal P/E of 17.07. All FIS needs to do is to trade up to a blended P/E of 13.41 by the end of 2025 to reward shareholders who buy FIS shares at $54.78 a 32.86% annualized rate of return or a capital appreciation of 93.37% in less than three years.
FIS looks like an undervalued company that has huge potential for capital appreciation in under three years. Great!
On the bottom right side of the panel (see below) is a brief summary of the company and what we like to see is the S&P Credit Rating and the LT Debt/Capital.
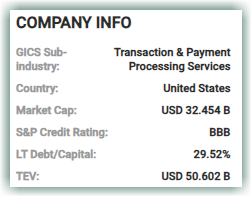
These tell us that FIS has an investment-grade level credit rating from S&P and that it has a relatively low LT Debt/Capital ratio. These imply that FIS appears to be a safe company that is unlikely to go bust.
When we select the “Performance” tab, we can see the following information.
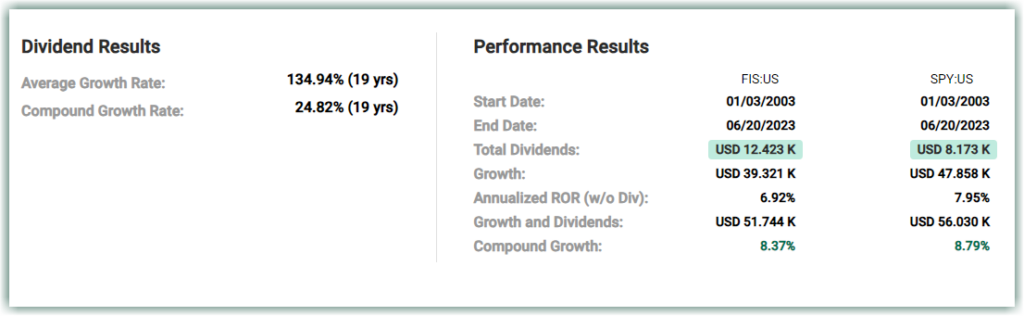
Interpreting this will help us consider if FIS is suitable to meet our investment goals. On the right, we see that FIS has slightly underperformed the index SPY over the last 19 years. However, we also see that FIS generated approximately 50% more dividends than an investment in the index would provide. On the left, we can see why: FIS is a dividend-compounding monster, with a dividend-compound growth rate of 24.82% over 19 years. For context, the dividends would have doubled after just 3.2 years at the rate of 24.82%, and in 19 years $1 would have ballooned into $67. Imagine collecting a mere $20 in annual dividends in 2003, and after holding FIS for 19 years, the payout will be $1353 annually.
However, it is our policy at FAST Graphs that measuring performance without simultaneously measuring valuation is a job half done. Stated differently, when measuring performance, the actual result is not meaningful unless you know why and how the performance was generated. Comparisons are best made when they are made on an “apples to apples” basis.
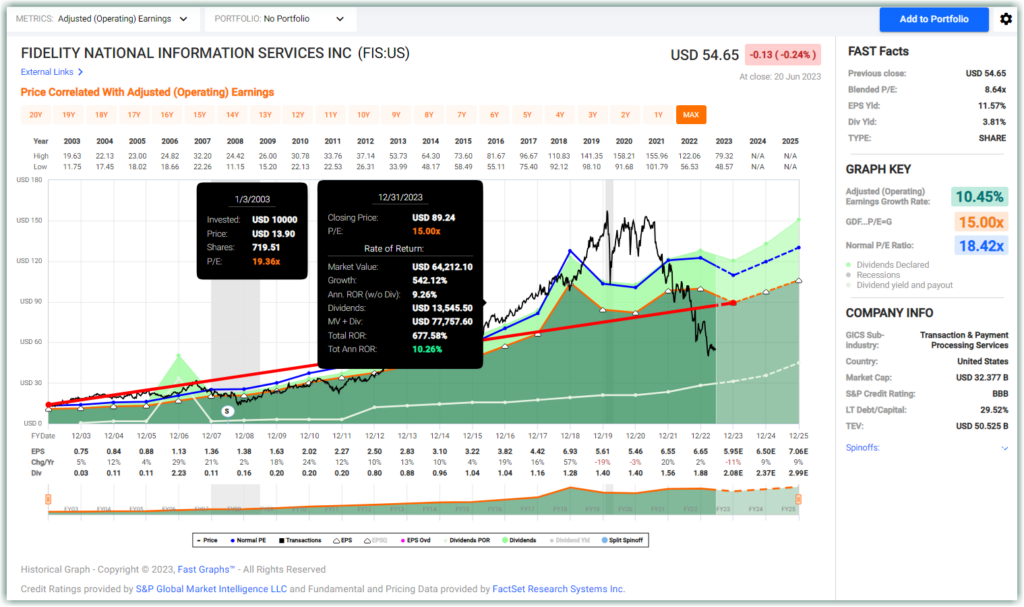
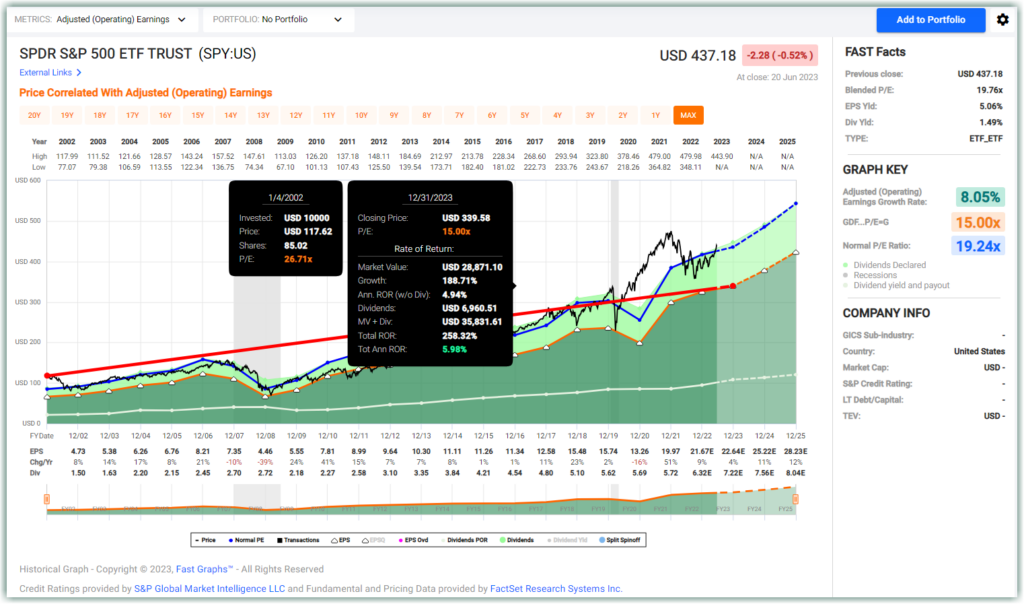
Therefore, it is important to point out FIS was moderately overvalued at the beginning of 2003 while SPY was highly overvalued at that time. But more importantly, SPY today is fully valued if not overvalued, while FIS is currently undervalued. The following two charts with performance calculated to theoretical fair value illustrate this point:
FIS the business grew earnings faster than SPY the ETF. Consequently, if performance were measured to fair value FIS would have (or should have) a return of 10.26% including dividends but not reinvested. Importantly, this return is consistent with the operating performance that the business actually generated over this timeframe.
In contrast, if the SPY’s performance was calibrated to fair valuation its performance would have been 5.98% which is slightly below the earnings growth rate but adjusted by the overvaluation at the beginning of the timeframe. Valuation matters, and it matters a lot but so does growth and fundamentals. Measuring one without considering the other is as previously mentioned a job half done.
Furthermore, regarding the dividend advantage of FIS over SPY, it is also important to point out that dividends are based on the number of shares owned and not the fluctuating stock price. In other words, stock price volatility had no bearing on the amount of dividends paid. Additionally, at the current payout ratio of just 28%, there does not seem to be any risk of a dividend cut; plus, there is a lot of room for the dividend to grow. FIS seems tailor-made and well-positioned with a margin of safety for Dividend Growth Investors.
Remember that we said FAST Graph is a tool to think with?
What if we examine FIS’s performance prior to its acquisition of Worldpay? Maybe that was an additional source of its underperformance. Also, notice that valuation was more in line with operating performance at the end but slightly diminished by the moderate overvaluation at the beginning.
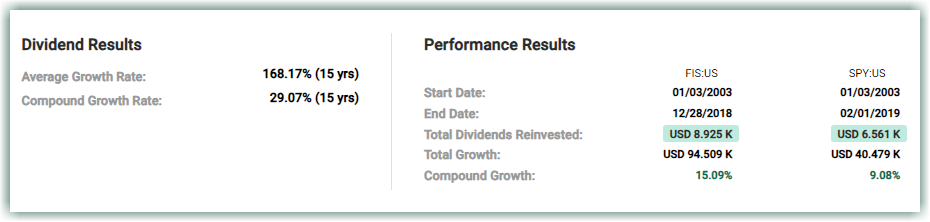
FAST Graphs can help us to answer questions like that with the click of a few buttons. And when we do that, and examine FIS’s performance from 2003 up until the end of 2018 and FIS’s 13.9% not just outperformed the index’s 8.11%, it demolished it. Once illustrating that valuation coupled with earnings growth matter and they matter a lot.
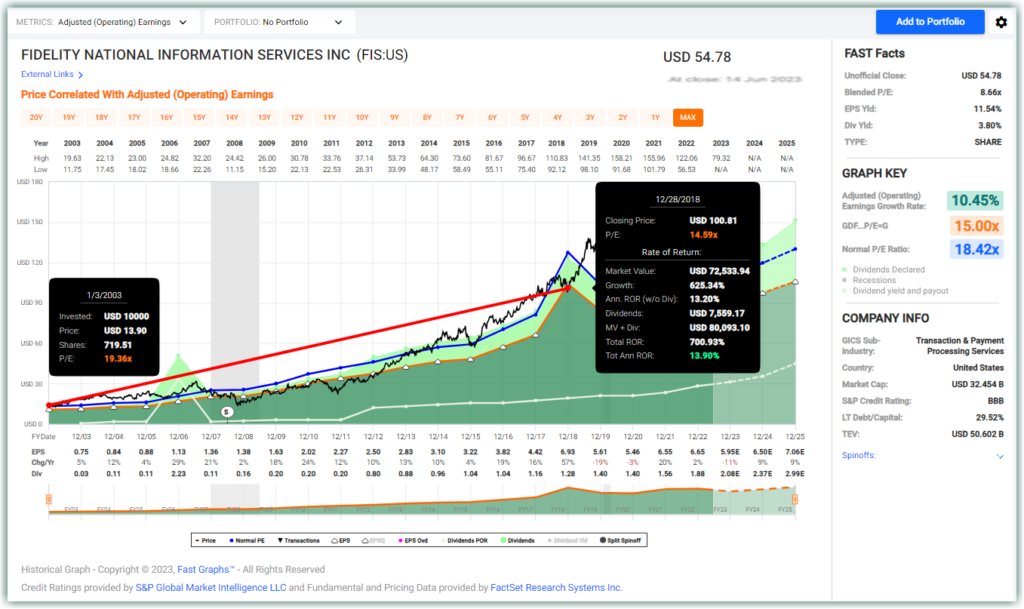
And when dividends are reinvested, the returns are boosted to 15.09%.
This changes the narrative completely, turning FIS from a dividend growth compounder to a total return candidate that is growing at a reasonable price.
What we illustrated above was to study a company’s past and present.
The past is important to give an indication of the fundamentals of the business. What we have seen is FIS has been
We can also see FIS’s present and know that it is currently
However powerful FAST Graph is, investors should not base their investments just based on charts and fundamental data. Investing should not be just based on a mechanical checklist of haves and haves-not. The collective story that is told by the fundamentals, the management, and the changing dynamics of each industry is important too. In short, both quantitative and qualitative aspects are important in investing to help us make rational, fact-based decisions to buy, sell or hold.
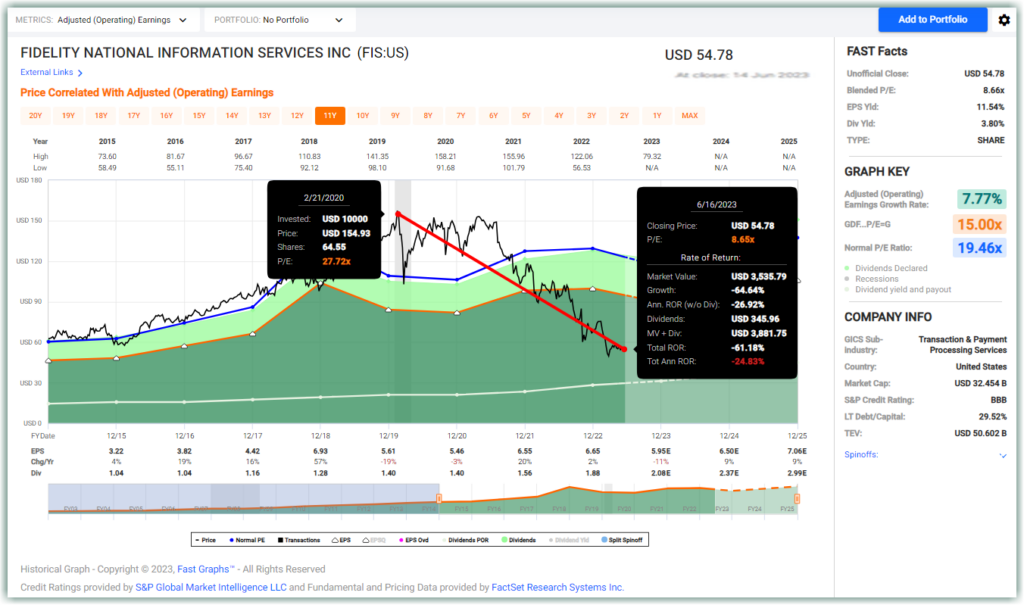
A company’s history tells us about its growth and profitability; its present tells us its present state. However, these do not tell us about its future growth and profitability. They certainly do not present clear answers to questions like: “Why did FIS’s share price fall by 64.6% in the past three and a half years? If FIS is so good, historically, why has it been underperforming even the index which gained 10% in the same time period?” Perhaps we can attribute the price collapse to the banking crisis which is an important component of the businesses in this subsector including but not limited to FIS. Prominent competitors such as GPN have suffered similar fates. In other words, the price issue may not just be company specific. This is where a more comprehensive research and due diligence process comes in.
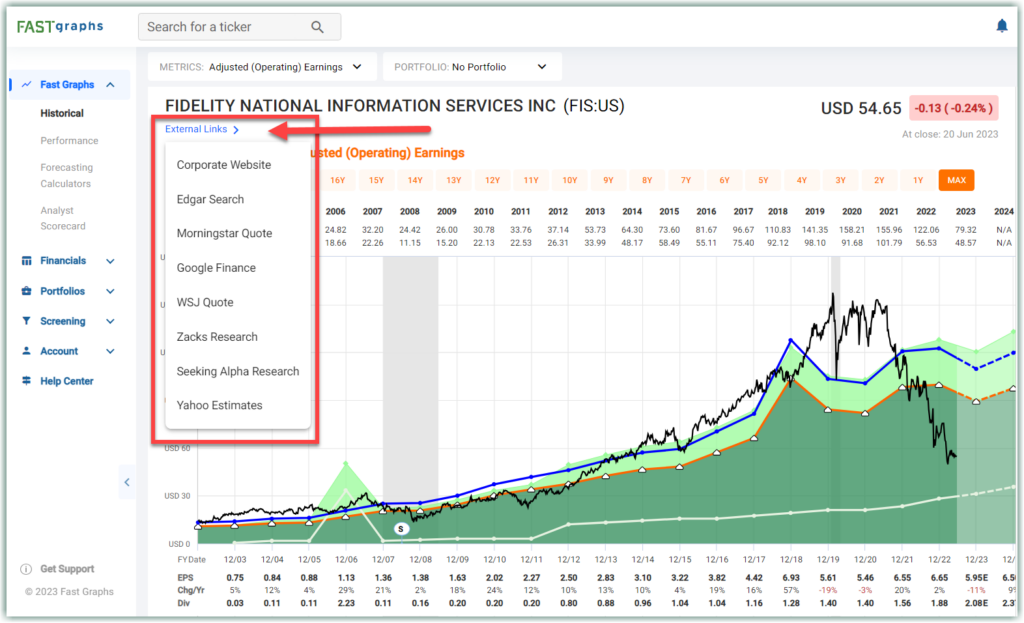
In order to facilitate a comprehensive research and due diligence process FAST Graphs provides external links to other research services. Therefore, subscribers can conduct a more comprehensive research process faster and easier than with other research tools. No due diligence process is perfect but this is one way to study a company, starting with FAST Graph while utilizing other research tools in our toolkit. The following illustrates the other research services that FAST Graphs provides links to:
With that, let’s dig in. Clearly, as we illustrated so far, there is a lot we can learn by studying the past operating history of any business we are interested in. On the other hand, since we can only invest in the future, then forecasting as accurately as possible is the key to future success. Which is why we believe that our forecasting calculators are such a vital and important first part of a comprehensive research and due diligence process.
The FAST Graphs forecasting calculators present the consensus forecasts of leading financial analysts collected by and reporting to our data provider FactSet. Our calculators also include a brief history of whether analysts have been increasing or decreasing their forecasts for each forward year presented. Therefore, subscribers can quickly and easily run “what if” scenarios that automatically calculate future return potential’s assuming estimates are reasonably correct.
Additionally, in order to support the forecasting process we provide our analyst scorecard that measures how accurate analysts have been when presenting forecasts either one year or two years in advance. These analyst scorecards can help guide subscribers into evaluating how much credence they should give analyst estimates on any company in question.
We ask ourselves a series of questions, and utilize the powerful fundamental features and analytical capabilities that FAST Graphs provide to help us answer these questions as accurately as possible.
No matter how investors choose to identify themselves – growth investors, value investors, income investors, dividend growth investors, even turnaround investors, and contrarian investors – everyone seeks growth in the businesses they invest in. After exhausting all the forecasting analytical features that FAST Graphs provide, we then turn to the provided financials from both the company and our tool.
Earlier, we have seen how the dividends have been growing over the past 19 years. Now, we will examine growth in other areas.
According to the 2022 10K,
FIS is a leading provider of technology solutions for financial institutions and businesses of all sizes and across any industry globally. We enable the movement of commerce by unlocking the financial technology that powers the world’s economy.
FIS serves primarily “financial institutions of all sizes in more than 100 countries (global financial institutions, U.S. regional and community banks, credit unions and commercial lenders, as well as government institutions and other commercial organizations) with core processing software, transaction processing software and complementary applications and services, many of which interact directly with core processing software”.
There are four revenue segments that FIS reports with three of them forming the majority of the revenue streams. The largest three segments are Banking Solutions (47%), Merchant Solutions (33.5%), and Capital Market Solutions (19.4%), followed by the last and smallest segment Corporate and Other (2%).
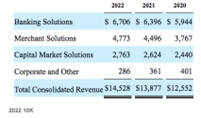
With the acquisition of Worldpay in 2019, revenue for Merchant Solutions increased immediately by 94%.
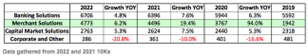
The revenue numbers for the three major segments look fine. All of them are growing through the
pandemic and into 2022.
Question 2: What does the future hold for FIS?
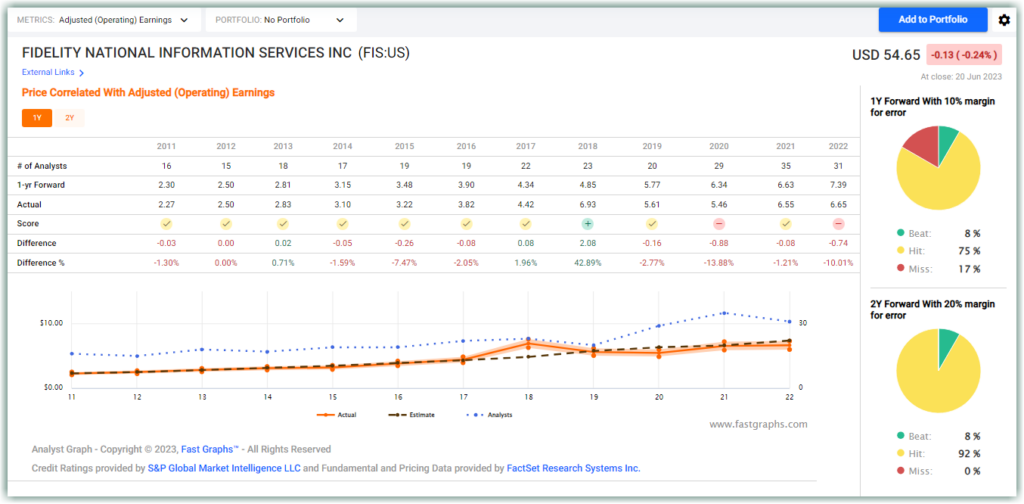
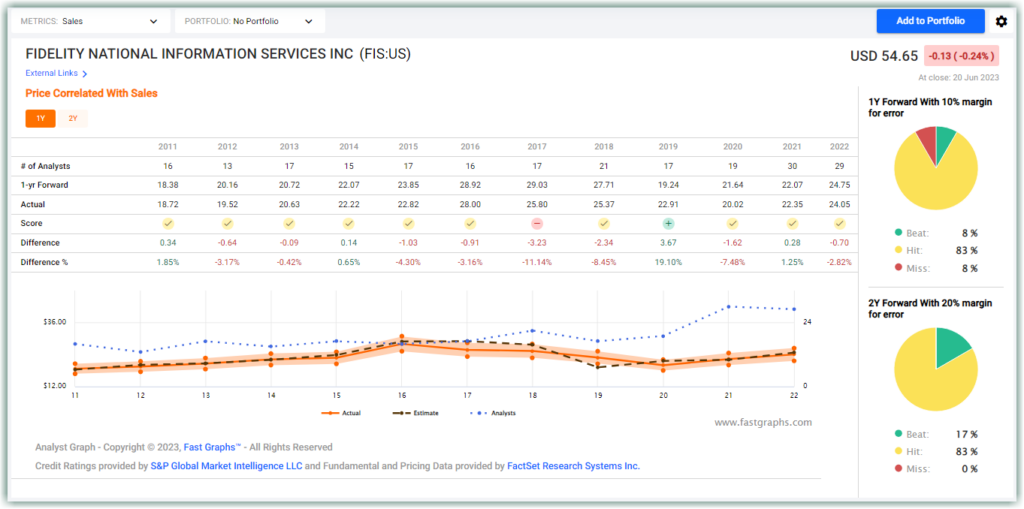
There is a host of earnings correlations that we can use to study the accuracy (and hence predictability) of how well the company performed against analysts’ past targets. After screening through the list of earnings correlations, we found that “Sales” correlates best. In FIS’s case, analysts were right most of the time in their 1-year and 2-year sales forecasts, giving us greater confidence in the accuracy of their forecasts for the next one to two years.
Now that we have examined the past and present, let’s take a peek into the possible future.
When evaluating the Analyst Scorecard when analysts were forecasting sales one year in advance, we see that the record is very strong. Analysts were correct 91% of the time within a reasonable margin of safety of 10%. 83% of the time they hit estimates within that margin of error, 8% of the time they beat analysts estimates, and only missed 8% of the time. Consequently, the reliability of analysts estimates regarding sales on this company can be confidently relied upon within a reasonable margin of safety.
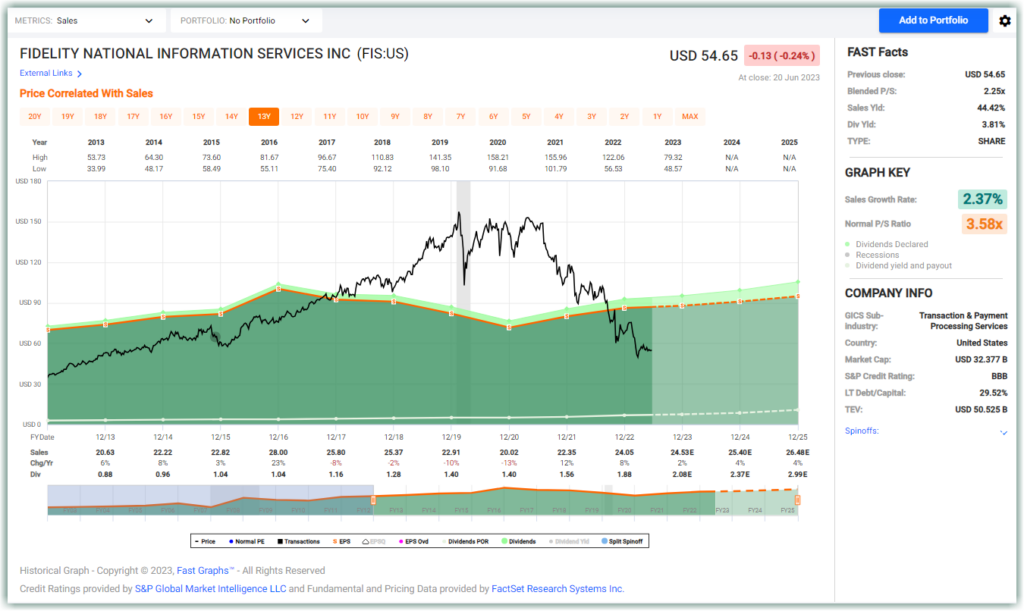
Normal Price to Sales
For the past 10 years, the normal P/S for FIS has been 3.58. That is really high, due to the surge in stock price immediately post-Worldpay as well as being a beneficiary of the pandemic-fueled-e-commerce-growth narrative during the first two years of the pandemic.
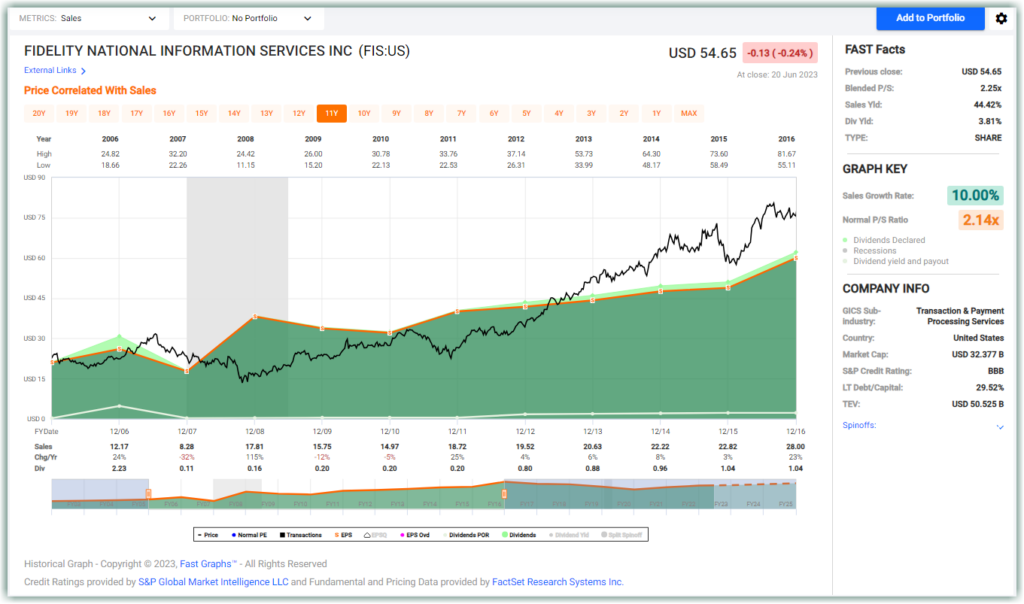
FIS’s normal P/S between 2006 to 2016 is closer to 2.14.
As mentioned in the introduction and in the answer to Question 1, FIS looks good. It is an investment-grade company with a long track record, has been growing revenue in all its major segments, and has been compounding dividends for a long time at a monster rate.
So, why has it underperformed the market? What’s wrong?
We can dig deeper into the financials using the FUN graph feature (or Financial Underlying Numbers) and generate the following graphic. More information can be found here.
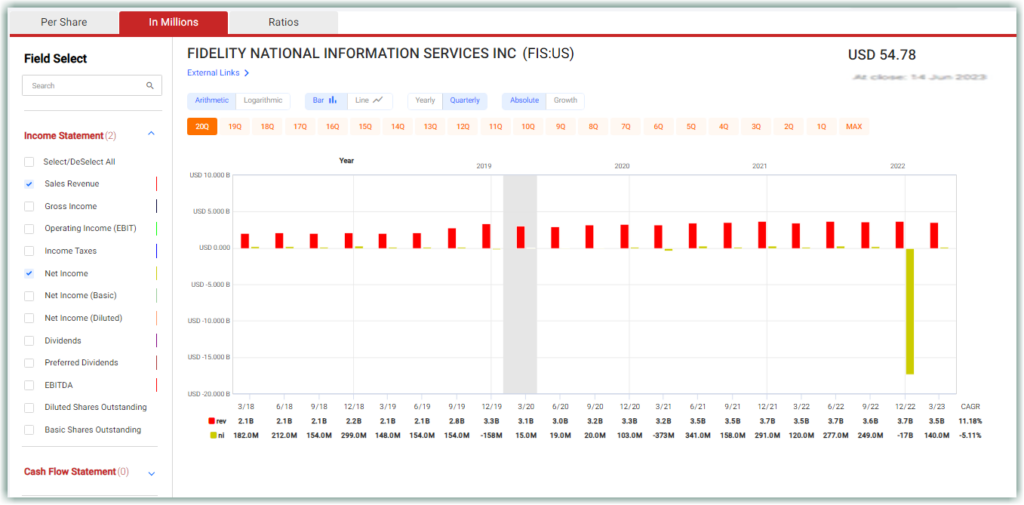
The above FUN graph displays the revenue and net income over 20 quarters.
The first issue is the most striking and obvious one: the $1.7 billion fall in net income registered in Q4 of 2022. The following was taken from page 14 of the 2022 10K,
“A significant portion of our revenue is derived from transaction processing fees. The global transaction processing industries depend heavily upon the overall level of consumer, business and government spending. Any change in economic factors, including a sustained deterioration in general economic conditions or consumer confidence, particularly in the U.S., or inflation and increases in interest rates in key countries in which we operate may adversely affect consumer spending, consumer debt levels and credit and debit card usage, and as a result, adversely affect our financial performance by reducing the number or average purchase amount of transactions that we service. Rising interest rates, inflation, and slowing economic growth in the U.S. and Europe began to negatively affect revenue growth and profitability in 2022, particularly in our Merchant Solutions segment. These effects began to accelerate in the fourth quarter of 2022 and are expected to continue to adversely affect our future financial performance. These expectations contributed to our fourth quarter 2022 goodwill impairment in our Merchant reporting unit, and further deterioration in macroeconomic conditions beyond our current expectations could contribute to further impairment.”
And the following was stated on page 25 of the 2022 10K,
“Pursuant to our annual goodwill impairment test that we began conducting in November 2022 with a quantitative analysis as of October 1, 2022, as supplemented by a further analysis measured as of December 31, 2022, we recorded a total goodwill impairment charge of $17.6 billion in the fourth quarter of 2022 for the Merchant reporting unit.”
As the goodwill is caused by the Worldpay acquisition, it indicates that the buyout is not working out as planned. Impairment is a message to investors that the value of the acquired assets (FIS paid $43 billion for Worldpay) has fallen below the amount that the company initially paid, and FIS has to write down as much as $17.6 billion in the current assets line.
The first silver lining is this impairment charge is not cash-based, so FIS’s available cash and cash equivalents are not affected. Another silver lining is the people responsible for the disastrous Worldpay acquisition, CEO Gary Norcross and CFO Woody Woodall, have been both replaced, although it remains to be seen if placing the former Worldpay CFO as the CEO of FIS is going to be the best move.
The second issue has to do with the uncertainties associated with this proposed spin-off. As stated on page 9 of the 2022 10K,
“On February 13, 2023, we announced our plans to spin off the Merchant business (“Spin-Co”), with the intention to create a new, publicly traded company. We expect the spin-off to be completed within the next 12 months… Through this transaction, FIS shareholders would receive a pro rata distribution of shares of SpinCo stock in a transaction that is expected to be tax-free to FIS and its shareholders for U.S. federal income tax purposes. The actual number of shares to be distributed to FIS shareholders will be determined prior to closing, as will the specific transaction structure. No assurance can be given that a spin-off will in fact occur on our desired timetable or at all.”
No details have been provided on the actual number of shares to be distributed to FIS shareholders, and the uncertainties can cause jitters.
Unfortunately, the above explanation – the impairment charge in Q4 of 2022 – is as a standalone reason insufficient to explain the decline of FIS’s stock price, which started in April of 2021. Since April 2021, FIS’s stock price collapsed by 64% while SPY gained more than 10%. However, to us we would add that the above catalysts coupled with the excessive overvaluation certainly played a major role. Our experience has taught us that overvalued companies will eventually and inevitably revert to the mean. All it takes is a catalyst such as described above. Moreover, once this occurs it is not uncommon, in fact quite common, that the market will overshoot valuation to the downside just as it did to the upside when the stock was overvalued.
The third issue lies in the worsening margins and increasing costs despite the “synergies” between the two companies after the merger. Although the revenue increased by 40.6% from FY 2019 to FY 2022, the cost incurred from Selling, General, and Administrative expenses increased far more by 71.1%.
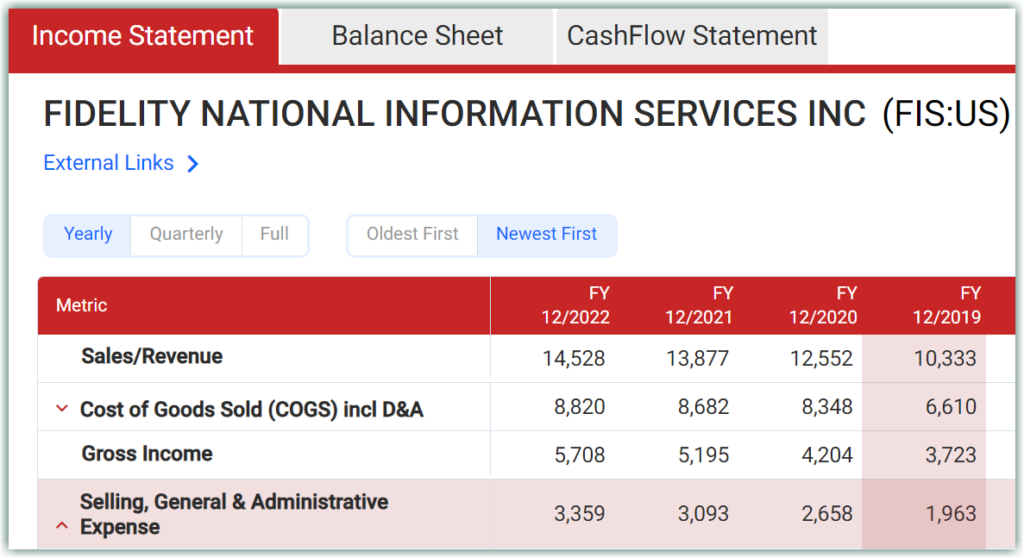
While the company managed to improve the gross margins of around 34%-35% pre-Worldpay to around 38% in the last 9 quarters, the operating margins fell from around 21% pre-Worldpay to 12.8% in the last 9 quarters.

The fourth reason is the high total debt that FIS holds on its balance sheet. Unlike the $9.1 billion SunGard acquisition in 2015 when FIS was able to reduce the total debt gradually over a few years, the debt taken on by FIS remains stubbornly high even after 4 years.
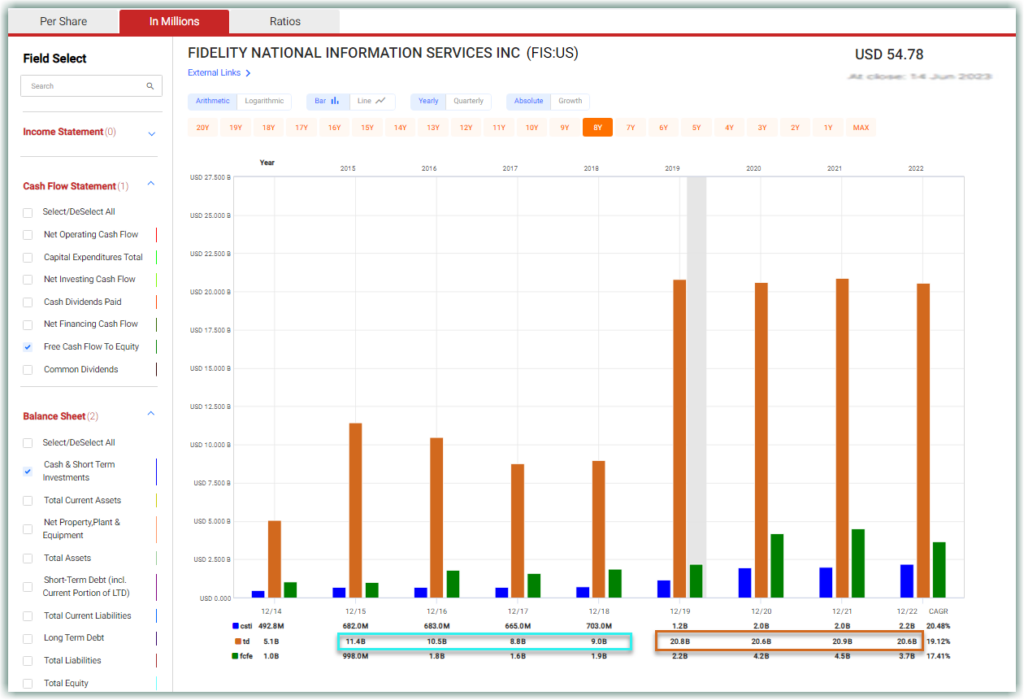
For a company seeking to grow not just organically but through acquisitions as well, the high debt and higher-than-usual leverage ratio of 3.2 as of March 2023 versus its targeted leverage ratio of 2.8, this does not bode well for growth in the business.
We believe that these four reasons have also contributed to why the stock has underperformed the index for the past two and a half years. But, as is clearly illustrated below, overvaluation represented a rational reason for most of the decline.
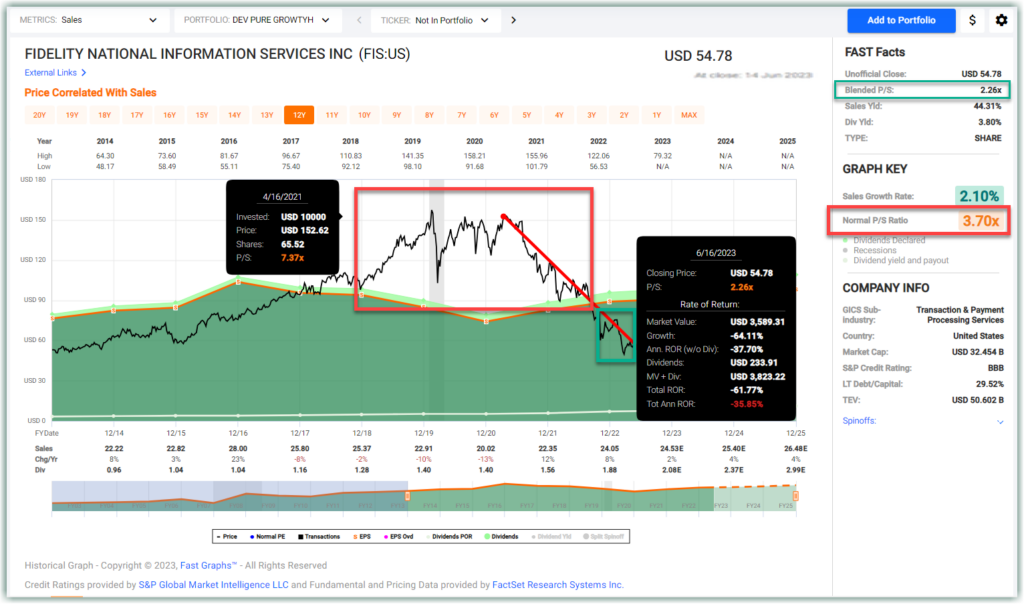
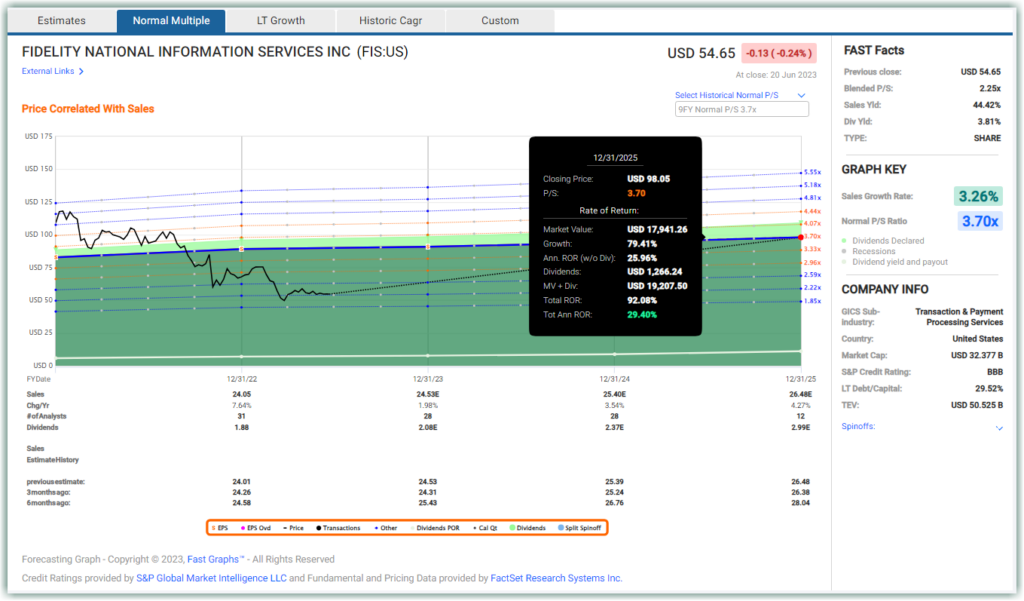
Despite those irregularities, it is clear from FAST Graph that to buy FIS at any point in time within the red box would have been buying above what FIS normally trades for. However, FIS is trading at a blended P/S of 2.26 now, which is way below its past 5-year P/S of 3.7, and close to its normal P/S of 2.14 between 2006 and 2016. Buying P/S now definitely offers much more value and a wider margin of safety compared to the period in the red box.
With the additional catalyst of having a new CEO in place whose first order of business was to eject the troublesome Worldpay and to reduce headcount in order to rightsize the company (i.e. to reduce the high SG&A costs and improve operating margins), there seem to be a brighter future for the company.
Analysts agree. In their most recently revised sales forecasts, they reverted the decline in sales in FY 2023 from 3 months ago and increased that slightly. The same optimism was projected out to FY 2024 and 2025 as well. However, the reader should note that forward growth is only expected to average 3.26%. Nevertheless, a price to sales ratio expansion as previously discussed back to 3.7 provides an exceptional opportunity for a high total return going forward. This is what margin of safety provides, a lower or muted risk offering a higher future return.
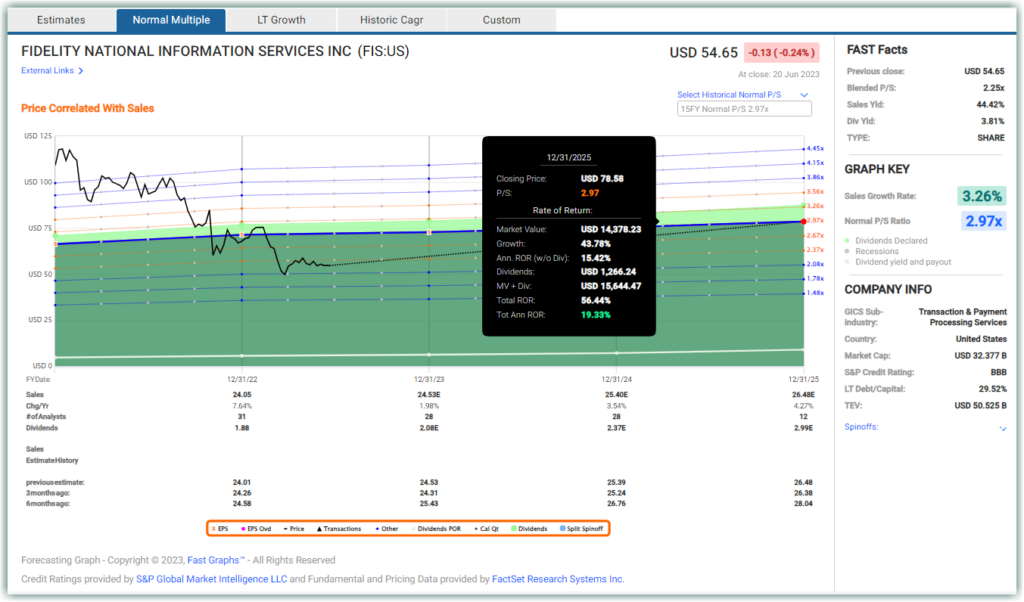
Assuming a lower normal P/S of just 2.97 which includes many years when the stock was trading below P/S of 2 to balance out the irrational exuberance in 2020 and 2021, if the stock can trade up from the current P/S of 2.25 to a P/S of 2.97 this will represent a 43.78% price appreciation in just 18 months, and after factoring in dividends the total return will be 56.44%, and the total annualized rate of return 19.33%.
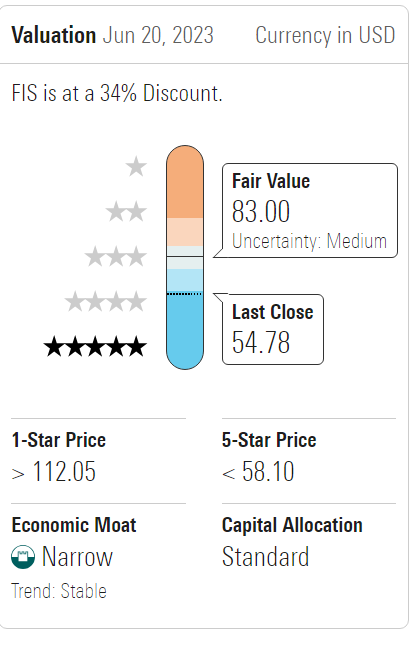
Additional confirmation of our valuation perspective is provided by Morningstar. They rate FIS 5 stars based on the current price being below their fair value target of $83 per share.
Considering all things equal, the removal of the former management in charge of the disastrous Worldpay acquisition and installing new management with a clear plan to reduce cost, improve margins, and eject the problematic Worldpay acquisition rather than spend time, money, and effort to fix the problem, and the low blended P/S of 2.25 that the company is trading at now, offers the rare opportunity to buy an excellent business at a very low valuation providing a large margin of safety. Conventional wisdom states that in order to earn higher rates of return you must be willing to take on higher levels of risk. Value investing turns that equation on its head. Value investors look to earn much higher rates of return at significantly lower levels of risk.
Try FAST Graphs for FREE Today!
SUBSCRIBE to our YouTube Channel
Click here for our Research Articles
Disclosure: Long PYPL, GPN
Disclaimer: The opinions in this document are for informational and educational purposes only and should not be construed as a recommendation to buy or sell the stocks mentioned or to solicit transactions or clients. Past performance of the companies discussed may not continue and the companies may not achieve the earnings growth as predicted. The information in this document is believed to be accurate, but under no circumstances should a person act upon the information contained within. We do not recommend that anyone act upon any investment information without first consulting an investment advisor as to the suitability of such investments for his specific situation.
FAST Graphs™ is a stock research tool that empowers subscribers to conduct fundamental stock research deeper and faster than ever before.